Figures & data
Figure 1. The results of hemoglobin electrophoresis and the purity of isolated NRBCs. (a) The average HbA and HbF levels of full-term female neonates and preterm female neonates. (b) Flow cytometry analysis of MNCs. (c) Flow cytometry analysis of isolated NRBCs, in which Q3 corresponds to CD71+ CD45− cells. (c) Wright’s staining (100×). (d) Brilliant cresyl blue staining of NRBCs (100×).
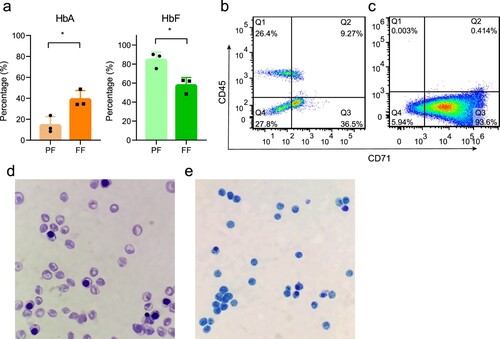
Figure 2. Differentially expressed transcripts between preterm and full-term neonates. (a) Volcano map of all miRNAs in the preterm and full-term groups. (b) Hierarchical clustering heat map of 79 differentially expressed miRNAs. (c, d) Differential expression profiles of known mRNA and lncRNA in the FF-vs-PF comparison.
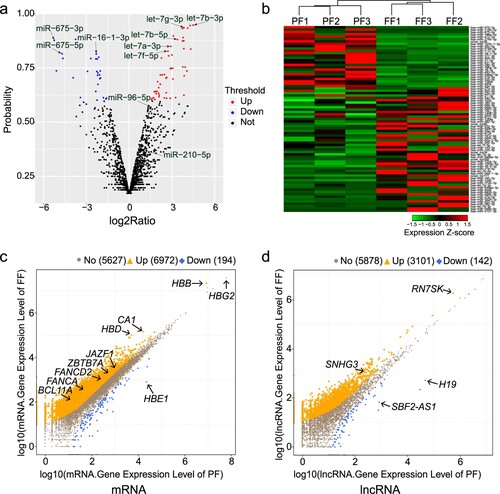
Figure 3. Comparative analysis of our sequencing data and published datasets. Warm colors (oranges/yellows) represent upregulation; cool colors (blues/greens) represent downregulation.
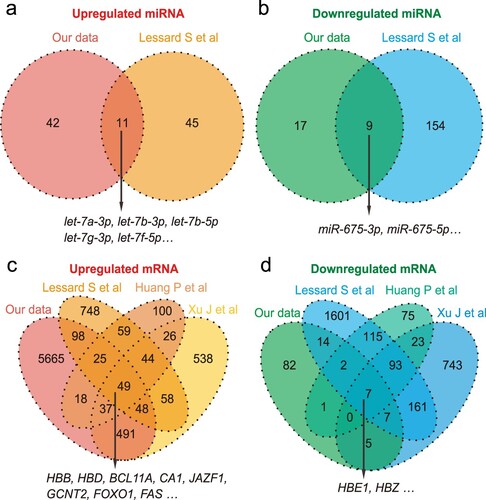
Figure 4. GO and KEGG enrichment analysis of differentially expressed mRNA. (a) GO enrichment analysis. The X-axis represents the number of genes. (b) KEGG enrichment analysis.
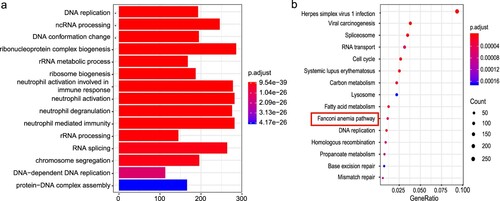
Figure 5. RT-qPCR-based detection of mRNA and lncRNA expression. (a) The expression levels of six upregulated genes in the full-term group. (b) The expression of three Fanconi anemia pathway-related genes. (c) The expression of two downregulated genes. (d) The expression of two miRNAs. (e)The expression of BCL11A based on sex segregation. PM: preterm male; PF: preterm female; FM: full-term male; FF: full-term female. The ordinate represents the fold change in relative quantity. Values shown are the mean ± SD (ns: P ≥ 0.05; *P < 0.05, **P < 0.01, ***P < 0.001; ****P < 0.0001).
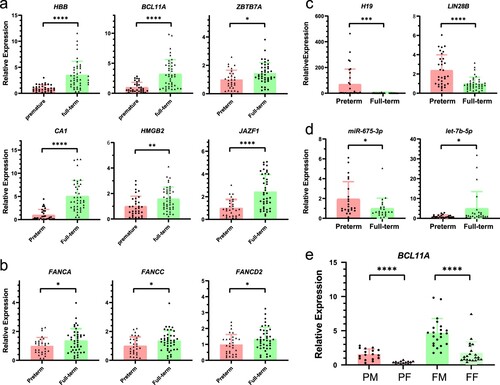
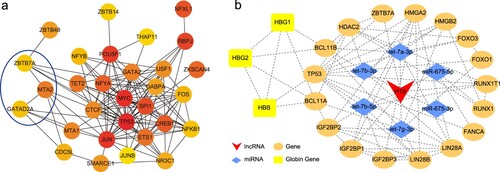
Figure 6. Hub genes of differentially expressed transcription factors and the H19-related lncRNA/miRNA/mRNA network. (a) Hub genes. Red represents a high connection degree and yellow represents a low connection degree. (b) The H19-related network. Red represents lncRNAs, blue represent miRNAs, orange represent genes, and yellow represents globin genes. Dotted lines denote interactions.