
Figures & data
Table 1. The top upregulated DEGs in MDS with relative to the healthy control.
Table 2. The top downregulated DEGs in MDS with relative to the healthy control.
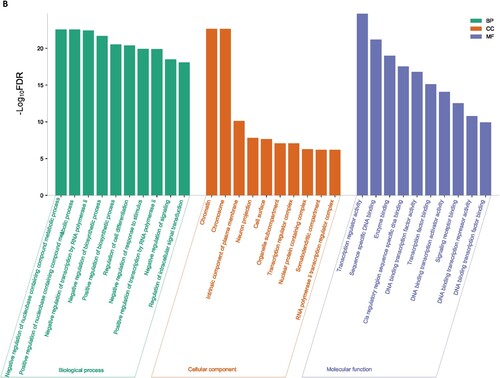
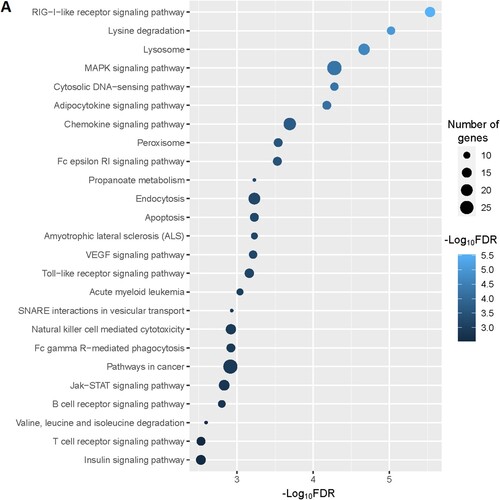
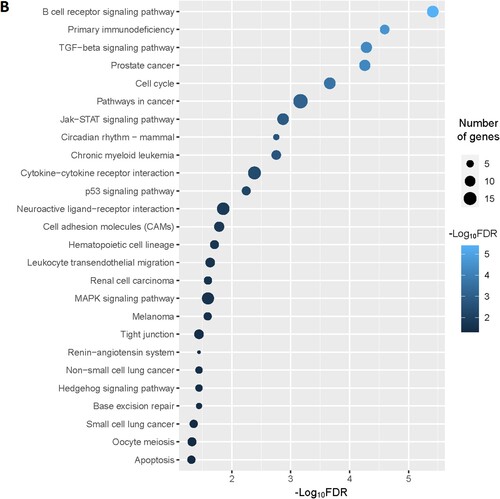
Table 3. The top ten upregulated and top ten downregulated hub genes were extracted from the original PPI. The hub genes were identified by using the Cytoscape plug-in CytoHubba tool.
Figure 4. MCODE-derived significant Clusters of upregulated DEGs in the MDS
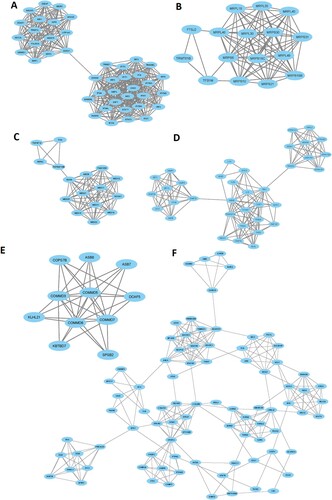
Table 4. The enriched KEGG pathways in the significant clusters of upregulated genes in the MDS. The pathways are identified using the GSEA tool.
Figure 5. MCODE-derived significant Cluster of downregulated genes in the MDS (A) and its functional enrichment analysis (B)
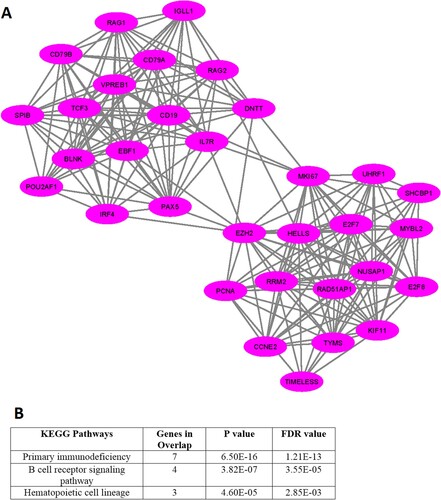
Figure 6. Consistent deregulation of hub genes in the independent dataset.
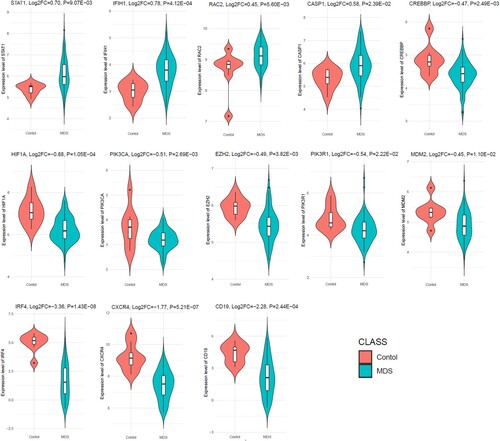
Figure 8. Diagnostic value of prognostic hub genes in the MDS. The MDS patients considering the cases and healthy sample is control.
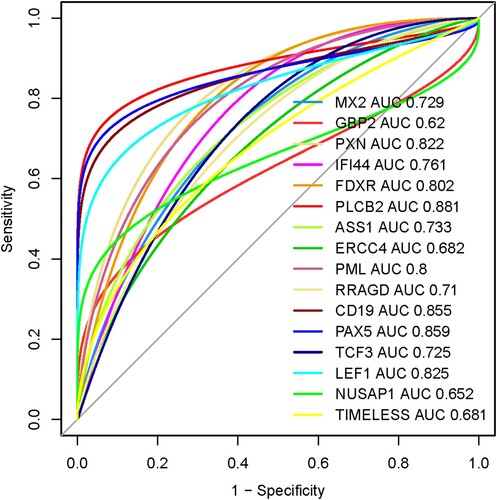
Table 5. The 16 prognostic genes with cut-off points, AUC, 95% CI, sensitivity, specificity, PPV, and NPV.
Supplemental Material
Download MS Excel (224.4 KB)Data availability
The GEO datasets (GSE4619 (n = 66), GSE19429 (n = 200), GSE30195 (n = 19), GSE58831 (n = 176), GSE114922) used in this study were downloaded from The National Biotechnology Information Center Gene (NCBI-Gene) database (https://www.ncbi.nlm.nih.gov/gene).