Figures & data
Figure 1. Schematic of HBA genes. E1–E3, exon 1–3. The black boxes show the probes specific to HBA1 and HBA2.
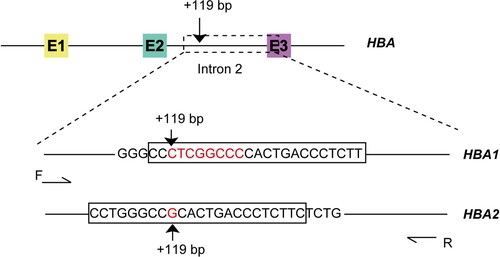
Figure 2. Ratio of copy number of HBA1 and HBA2 in different genotypes. (a) Copy number for HBA1 and HBA2 in different deletional α-thalassemia. (b and c) Individuals with –THAI compounded with -α3.7 deletion (b) and heterozygous for αααanti4.2 (c). Blue droplets indicate positive HBA1 or HBA2, while green droplets represent RPP30.
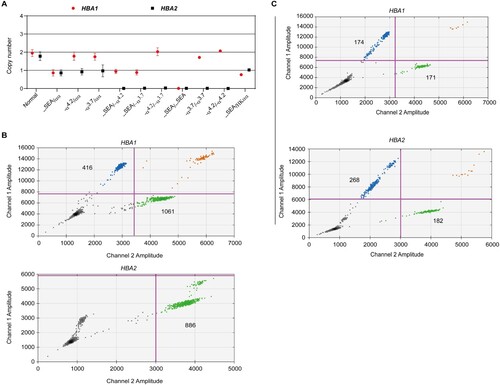
Table 1. Copy number of HBA1 and HBA2 in different genotypes.
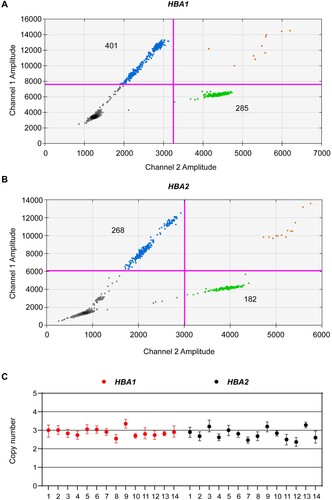
Figure 3. DdPCR assay for the quantification of trisomy 16. (a and b) Plots showing the distribution of positive and negative droplets. Blue droplets indicate positive HBA1 or HBA2, while green droplets represent RPP30. (c) Copy number of 14 trisomy 16. Data are shown as mean ± SD.