
Figures & data
Figure 1. The CE result for the proband shows the Hb X fraction, which corresponds to the hemoglobin Santa Ana peak.
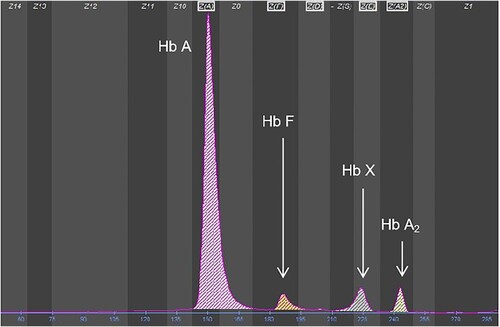
Figure 2. The result of Sanger sequencing. The arrow indicates the CTG > CCG mutation at codon 88 of the HBB gene previously reported as hemoglobin Santa Ana.
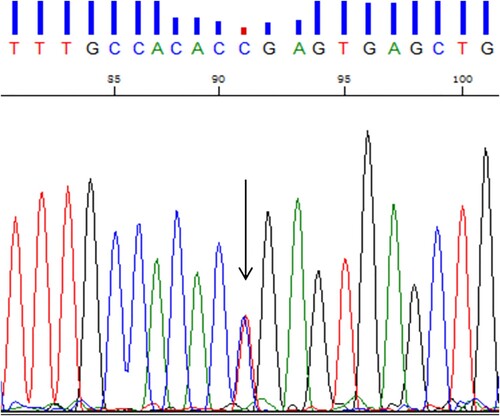
Table 1. Hematological and genotypic data of the family members.
Table 2. Unstable hemoglobin variants migrated at zone 4 on the CE electrophoregram.