
Figures & data
Figure 1. aPTT-clot waveform analysis transmittance curve (A) and the first (B) and second derivatives (C). Trans%: Percentage of transmittance, dT/dt: the derivative of transmittance taken with respect to time, d2T/dt2: the second derivative calculated from dT/dt with respect to time Min 1: Maximum clotting velocity, Min 2: Maximum clotting acceleration, Max2: Maximum clotting deceleration
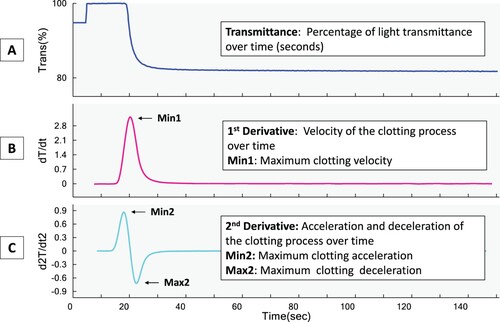
Table 1. Laboratory results, PT, aPTT and its associated CWA parameters and thrombin generation results of 54 study subjects on warfarin.
Figure 2. A comparison of thrombin generation curves measured by the CAT and aPTT-CWA transmittance curves of two different patients with two extremes of INR ranges of 1.94 and 4.50 r, respectively. (A) and (C) show the thrombin generation curves while (B) and (D) show the 1st and 2nd derivatives curves of the aPTT-based clot waveform transmittance curves. CAT: Calibrated automated thrombogram; CWA: Clot waveform analysis; ETP: Endogenous thrombin potential.
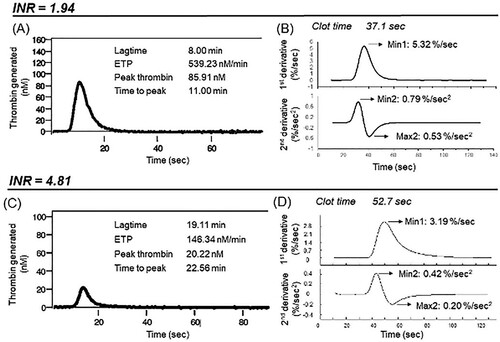
Table 2. Correlation between aPTT-CWA and thrombin generation parameters in 54 patients on warfarin anticoagulation*.
Table 3. Correlation between unadjusted PT-CWA and INR and thrombin generation parameters respectively in 54 patients on warfarin anticoagulation*/**.