
Figures & data
Table 1. Baseline patient characteristics
Figure 1. Eltrombopag dose over time. Box plot indicating median (internal horizontal line), 25th and 75th percentiles (lower and upper box limits, respectively) and 5th–95th percentile (bars).
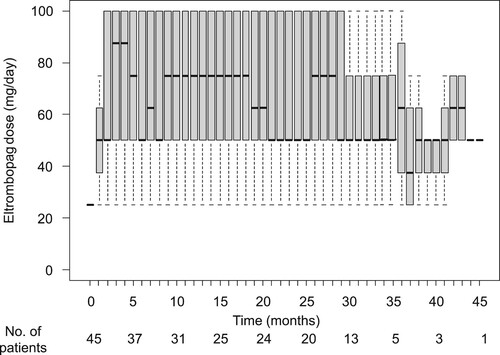
Table 2. Outcome of TPO-RA treatment.
Figure 2. Response to TPO-RA by lineage. (A) Number of responders in each lineage at 6 months. (B) Best response during the entire follow-up period. Yellow, platelet; red, erythroid; blue, neutrophil responses.
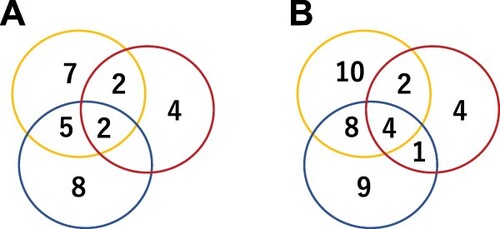
Figure 3. Response to TPO-RA treatment over time by lineage. (A) neutrophil, (B) erythroid, and (C) platelet responses. Box plots indicate median (internal horizontal line), 25th and 75th percentiles (lower and upper box limits, respectively) and 5th–95th percentile (bars).
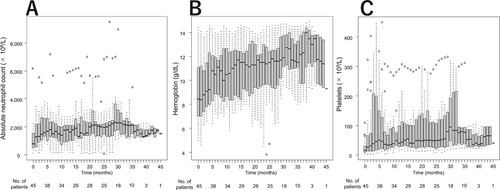
Table 3. Hematologic response to TPO-RAs by lineage.
Table 4. Adverse events during TPO-RA treatment.
Table 5. Univariate analysis of factors for response to eltrombopag.