Figures & data
Table 1. The primer sequence for genes.
Figure 1. The volcano figure and heatmap of DEGs and sample clustering and soft threshold screening. (A and B) Volcano and heatmap of DEGs between in the multiple myaloma and MGUS. 50 upregulated DEGs are shown in red; 228 downregulated DEGs are shown in green; non-DEGs are shown in gray.
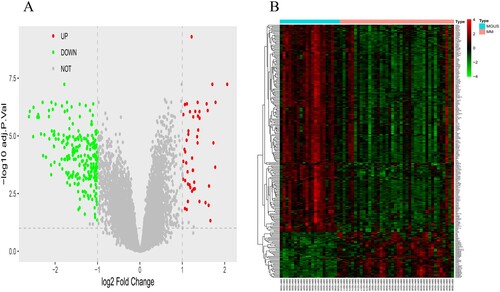
Figure 2. Construction of weighted gene co-expression module: (A) Analysis of network topology for various soft-thresholding powers (weighting coefficient, β). The x-axis represents different soft-thresholding powers. The y-axis represents the correlation coefficient between log (k) and log [P(k)]. The red line indicates a correlation coefficient of 0.9. (B) Average network connectivity under different weighting coefficients. (C) Histogram of connectivity distribution at β = 7. (D) Validation of scale-free topology at β = 7. DEGs: differentially expressed genes, MGUS: monoclonal immunoglobulinemia of unknown significance. (E) The heatmap depicts the TOM among all DEGs in the analysis, darker yellow indicates greater overlap, and light color indicates low overlap. Modules are dark blocks along the diagonal. Module assignment genes and trees are also shown at the top and left, respectively. (F) Clustering dendrogram of all DEGs with different similarities based on topological overlap, with assigned module colors. A total of 18 coexpression modules were constructed and shown in different colors. Relationship between modules and clinical features. (G) Module-trait associations. (H) Hierarchical clustering dendrogram of MEs (labeled with the corresponding colors). In the heatmap, red indicates high adjacency (positive correlation), whereas blue indicates low adjacency (negative correlation).
![Figure 2. Construction of weighted gene co-expression module: (A) Analysis of network topology for various soft-thresholding powers (weighting coefficient, β). The x-axis represents different soft-thresholding powers. The y-axis represents the correlation coefficient between log (k) and log [P(k)]. The red line indicates a correlation coefficient of 0.9. (B) Average network connectivity under different weighting coefficients. (C) Histogram of connectivity distribution at β = 7. (D) Validation of scale-free topology at β = 7. DEGs: differentially expressed genes, MGUS: monoclonal immunoglobulinemia of unknown significance. (E) The heatmap depicts the TOM among all DEGs in the analysis, darker yellow indicates greater overlap, and light color indicates low overlap. Modules are dark blocks along the diagonal. Module assignment genes and trees are also shown at the top and left, respectively. (F) Clustering dendrogram of all DEGs with different similarities based on topological overlap, with assigned module colors. A total of 18 coexpression modules were constructed and shown in different colors. Relationship between modules and clinical features. (G) Module-trait associations. (H) Hierarchical clustering dendrogram of MEs (labeled with the corresponding colors). In the heatmap, red indicates high adjacency (positive correlation), whereas blue indicates low adjacency (negative correlation).](/cms/asset/c5ff8c32-c23a-4d3e-9a40-31f189a7719d/yhem_a_2046326_f0002_oc.jpg)
Figure 3. Module and eigengene network plots the flowchart for screening hub genes. (A)–(C) Scatterplots of GS for tumor differentiation (y-axis) versus MM (x-axis) in three modules. (D) Venn diagrams of hub genes in WGCNA and DEGs. Analysis of key genes and biological functions and signaling pathways enriched by 238 key genes: (E) The main biological processes of genes enriched in 238 key genes (F)The main KEGG pathway of genes enriched in 238 key genes.
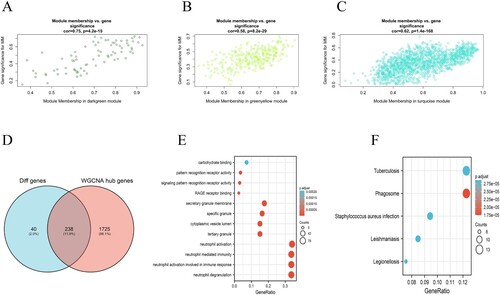
Figure 4. Four ROC curves with different areas under the ROC curve values. The chance diagonal (Reference line, the line segment from 0, 0 to1, 1) has an area under the ROC curve of 0.5. Tested SNORA71A with the highest area under the ROC curve had the best overall diagnostic performance in the tested SNORA49, SNORA68, and SNORA71A.
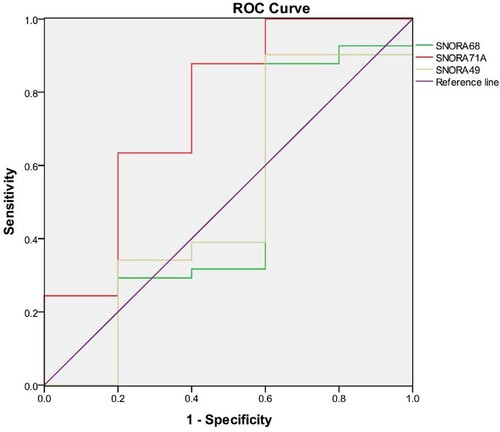
Table 2. ROC area, P-value, cut-off value, specificity, and sensitivity for SNORA49, SNORA68, and SNORA71.
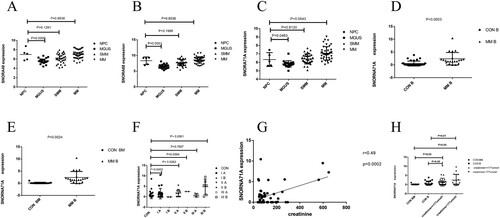
Figure 5. Analysis of key genes. NPC: normal plasma cell, MGUS: monoclonal immunoglobulinemia of unknown significance, SMM: smoking multiple myeloma, MM: multiple myeloma, B: blood, BM: T bone marrow. (A)–(C) Expression of SNORA49, SNORA68 and SNORA71A in the GSE47552 data set, P < 0.05 is considered statistically significant. (D) SNORA71A relative expression in 21 patients with peripheral blood samples from multiple myeloma and 13 healthy people with bone marrow were analyzed by RT-PCR. (E) SNORA71A relative expression in 21 patients with peripheral blood samples from multiple myeloma and 37 healthy people with peripheral blood were analyzed by RT-PCR. (F) The expression level of SNORA71A was analyzed according to ISS stage of multiple myeloma. (G) Pearson's correlation analysis of the positive correlations with SNORA71A in patients with multiple myeloma (H) Analysis of SNORA71A expression levels in creatinine value of patients with multiple myeloma <177umol/L and ≤ 177umol/ L groups.