
Figures & data
Table 1. Patient characteristics.
Figure 1. Serum immunoglobulin G and infectious diseases during the clinical course in three patients treated with immunoglobulin replacement therapy. Results representative of the events are shown as follows: red bar, immunoglobulin G (IgG) level; blue bar, a period of an infectious disease; grey box, one cycle of bendamustine and rituximab (BR) therapy; black arrow, one dose of intravenous immunoglobulin (IVIG). The patient code (FL03, FL15 and FL20) is indicated on the left side.
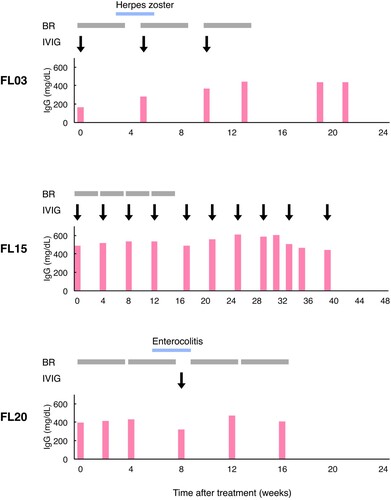
Table 2. Infection occurring in relapsed or refractory follicular lymphoma patients treated with chemotherapy with bendamustine.
Table 3. Comparison of clinicopathological characteristics between infected and uninfected lymphoma patients.
Figure 2. Laboratory parameters reflecting the immune system function in patients with and without infection before, during and after chemotherapy with the combination of bendamustine and rituximab. The results of routine laboratory tests of immune-related parameters, i.e. peripheral blood leukocyte count, neutrophil count, lymphocyte count and immunoglobulin G (IgG) value, were collected from the initiation of bendamustine and rituximab (BR) either until 6 months after the completion or discontinuation of BR or until the commencement of the subsequent chemotherapy regimen if the treatment started within 6 months after the end of BR therapy. Patients were divided into two groups, i.e. infected and uninfected patient groups (grey and white areas in the graphs, respectively). The dot plots of each parameter ((A), leukocyte count; (B), neutrophil count; (C), lymphocyte count; (D), IgG level) were drawn with the baseline measurements before BR and the minimal measurements during and after BR therapy per patient (blue dot, the baseline measurement; red dot, the minimal measurement). The X-axis shows the patient code, while the y-axis shows the value of each laboratory parameter. Differences between the patient groups were analysed using Wilcoxon rank sum test and indicated above the graphs. Before BR, the baseline value before the commencement of BR therapy; During and after BR, the minimal value obtained from the initiation of BR therapy until either 6 months after the last cycle of BR or the commencement of the next chemotherapy regimen if the treatment was started within 6 months after the completion or discontinuation of BR therapy; IgG, immunoglobulin G.
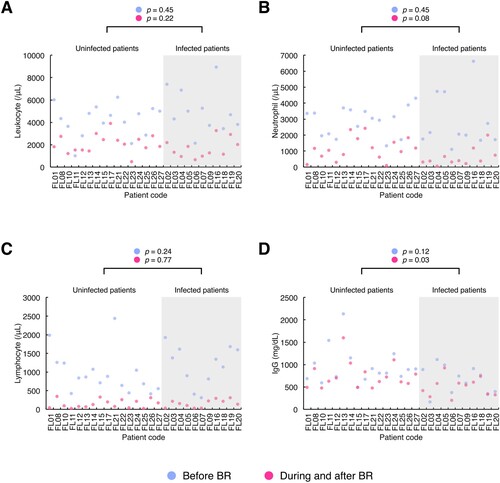
Figure 3. Receiver operating characteristic curves of immunological laboratory parameters for infection before, during and after BR therapy. The receiver operating characteristic (ROC) analysis was performed to assess the diagnostic accuracy of the leukocyte count, neutrophil count, lymphocyte count and immunoglobulin G (IgG) level for the occurrence of infection, with both the baseline and minimal values of each parameter. When the lower limit of the 95% confidence interval of the area under the ROC curve was >0.5, the parameter was considered to be effective for discriminating infectious events. The curves of each parameter before ((A), leukocyte count; (C), neutrophil count; (E), lymphocyte count; (G), IgG level), during and after ((B), leukocyte count; (D), neutrophil count; (F), lymphocyte count; (H), IgG level) BR therapy are shown. AUC, area under the curve; Before BR, before the commencement of BR therapy; CI, confidence interval; During and after BR, from the initiation of BR therapy until either 6 months after the last cycle of BR or the commencement of the subsequent chemotherapy regimen if the treatment was started within 6 months after the completion or discontinuation of BR therapy; IgG, immunoglobulin G.
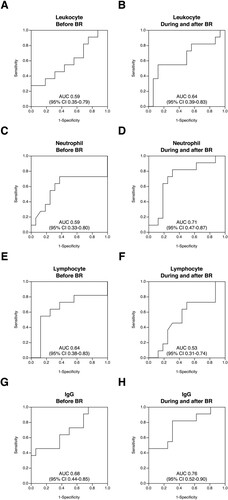
Table 4. Associations between clinicopathological and immunological variables and infection in follicular lymphoma patients treated with bendamustine and rituximab.