
Figures & data
Figure 1. Kaplan–Meier plots of (a) OS and (b) EFS in 55 patients. The 1-year, 2-year, and 3-year OS rates were 74.5%, 61.8%, and 61.8%, respectively. The 1-year, 2-year, and 3-year EFS rates were 63.6%, 58.2%, and 56.4%, respectively.
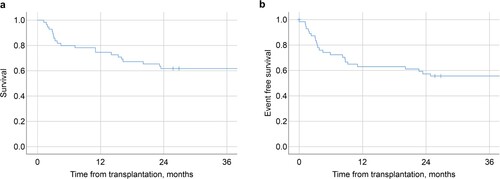
Table 1. Characteristics of the 55 patients.
Table 2. Clinical variables for the 55 patients and p-values by univariate analysis for OS and EFS.
Table 3. Multivariate analysis, regression coefficient, and scoring system for 3-year OS and EFS.
Figure 2. ROC curves of the risk model for three-year (a) OS and (b) EFS in all patients. The area under the curve were (a) 0.738 and (b) 0.778 for OS and EFS, respectively. The cutoff values for OS and EFS were (a) 1.635 and (b) 1.420, respectively.
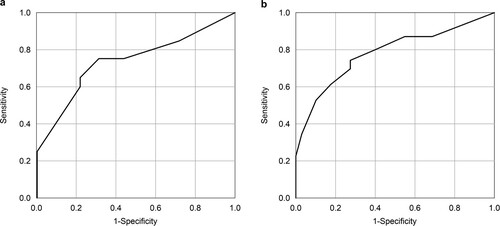
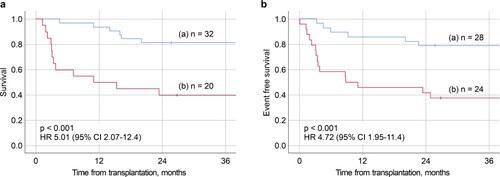
Figure 3. (a) Kaplan–Meier plots of the group (a) lower and (b) higher than the cutoff value point in the risk model for three-year OS. The three-year OS rates were 81.2% for the lower group and 40.0% for the higher group. (b) Kaplan–Meier plots of the group (a) lower and (b) higher than the cutoff value point in the risk model for three-year EFS. The three-year EFS rates were 78.6% for the lower group and 37.5% for the higher group.
Data availability statement
The data supporting the results of this study are available from the corresponding author upon a reasonable request.