
Figures & data
Table 1. Baseline features of patients (n = 104).
Figure 1. Graphic displaying genetic baseline features of B-lineage ALL cohort.
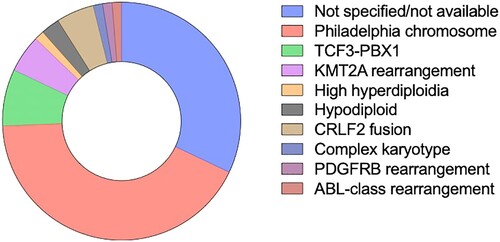
Figure 2. OS Kaplan-Meier curve according to the initial regimen.
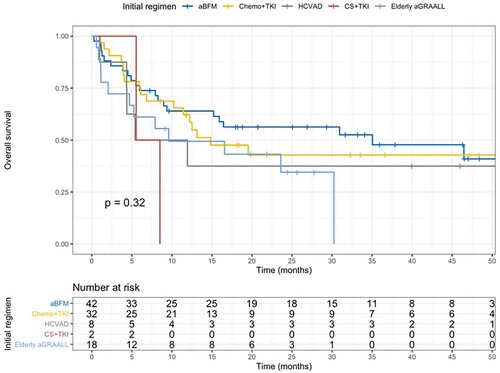
Figure 3. OS and EFS curves according to the genetic subset within B-lineage cases.
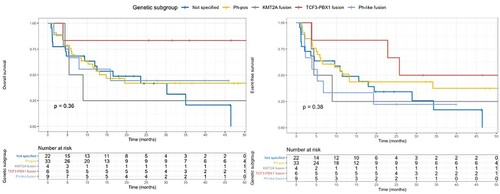
Table 2. Treatment and outcomes of patients with ‘Ph-like’ alterations.
Supplemental material