
Figures & data
Table 1. Clinical characteristics of AML patients in TCGA and GEO cohorts.
Figure 1. Genomic instability characteristics-based hierarchical clustering of TCGA samples. (a) Kaplan–Meier survival analysis of genomic stable (GS) and genomic unstable (GU) groups. (b) Hierarchical clustering of TCGA AML samples. Samples were classified into GU-like and GS-like groups. (c) Boxplot for somatic mutation counts. (d) Co-expression network of lncRNAs and protein-coding genes. (e) Functional enrichment analysis of GO terms for protein-coding genes.
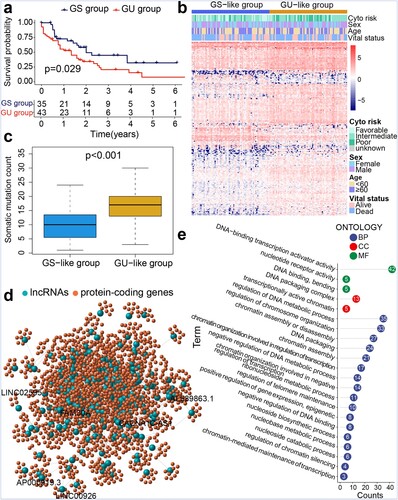
Figure 2. Construction of SMRI of AML patients in TCGA. Kaplan–Meier survival plots of high SMRI and low SMRI groups in the training (a), A (d), and B (g) cohorts. ROC curve analysis of SMRI and clinical characteristics in the training (b), A (e), and B (h) cohorts. Distribution of gene expression, SMRI, and vital status in the training (c), A (f), and B (i) cohorts.
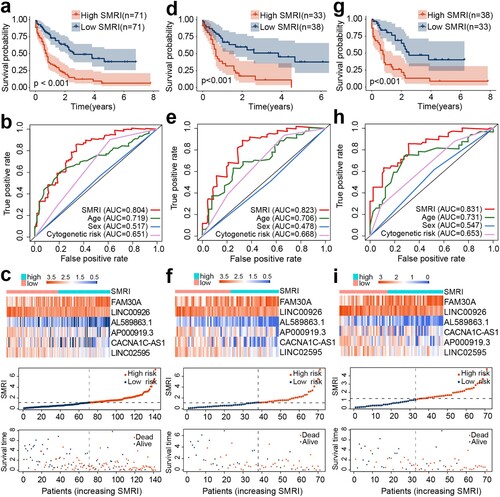
Figure 3. Validation of SMRI in GEO. (a) Kaplan–Meier survival analysis of SMRI subtypes. (b) The area under the ROC curve based on SMRI, age, sex, and cytogenetic risk. (c) The variation trends of lncRNA expression, SMRI, and vital status of the risk subgroups. (d) Univariate and Multivariate analysis of SMRI and other prognostic factors in GEO dataset.
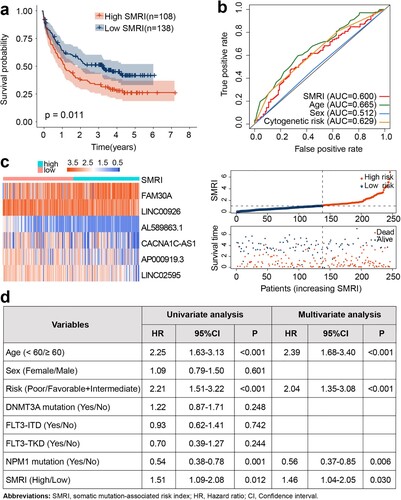
Table 2. Univariate and Multivariate analysis of SMRI and other prognostic factors in TCGA dataset.
Figure 4. Stratified survival analysis and differential distribution of SMRI in TCGA clinical subgroups. Kaplan–Meier survival curves of SMRI subtypes in clinical subgroups, samples were classified according to age (a), cytogenetic risk (b), and sex (c). (d-i) Differences of the SMRI in clinical subgroups.
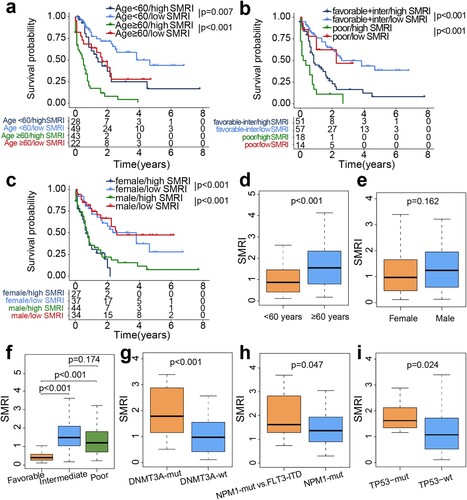
Figure 5. Distribution of clinical features and GSVA of risk subgroups in training cohort. (a) Differences in clinicopathological characteristics and gene mutation status. (b) Heatmap of subgroup-specific biological pathways.
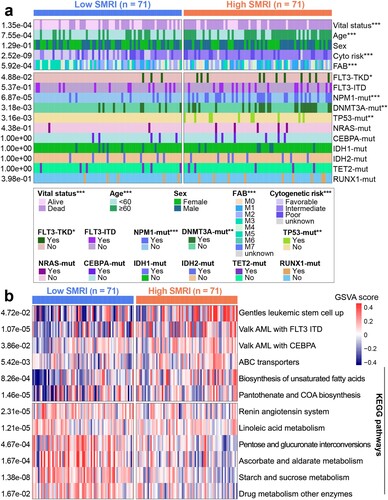
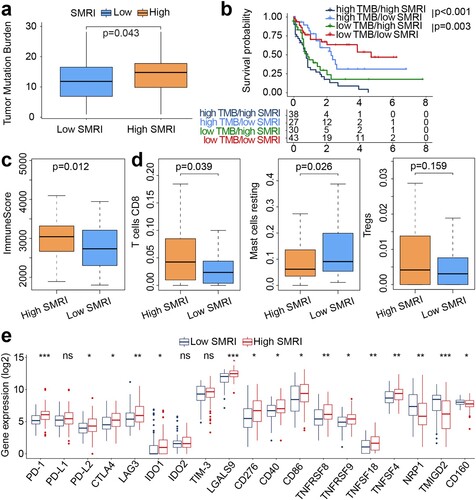
Figure 6. Mutation profiles and immune landscapes of risk subgroups in the training cohort. (a) Boxplot of TMB between risk subgroups (high SMRI and low SMRI groups). (b) Kaplan–Meier survival curves of SMRI subtypes in high TMB and low TMB groups. (c) Boxplot of immune score between risk subgroups. (d) Boxplot for immune cell infiltration. (e) Boxplot for immune checkpoint expression. *p < 0.05, **p < 0.01, ***p < 0.001.
Supplemental Material
Download MS Word (1.4 MB)Supplemental Material
Download MS Excel (32.6 KB)Data availability statement
All data related to this manuscript can be downloaded for free from TCGA (https://portal.gdc.cancer.gov/), GEO (https://www.ncbi.nlm.nih.gov/geo/), and UCSC Xena (https://xenabrowser.net/).