
Figures & data
Table 1. The clinical characteristics of patients in t(8;21) with LOS group (n = 36) and t(8;21) alone group (n = 37).
Figure 1. Curves comparison of OS and DFS for t(8;21) with LOS group and t(8;21) alone group.
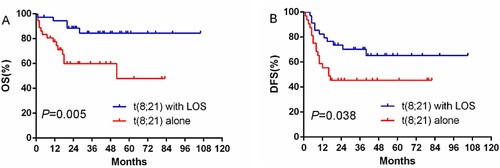
Figure 2. Curves comparison of OS and DFS for t(8;21) with LOS group and t(8;21) alone group with HDAC consolation therapy.
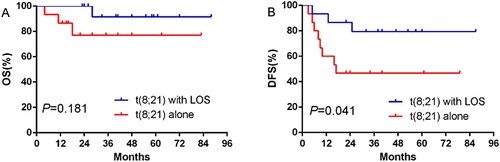
Table 2. Treatments and outcomes of t(8;21) with LOS group (n = 36) and t(8;21) alone group (n = 37).
Table 3. Univariate and multivariable cox regression analysis of t (8;21) AML patients’ clinical parameters in DFS.
Table 4. Univariate and multivariable cox regression analysis of t (8;21) AML patients’ clinical parameters in OS.