Figures & data
Figure 1. Circ_KCNQ5 was overexpressed in AML bone marrow sample and AML cell lines. (A) The expression of circ_KCNQ5 in bone marrow samples from AML patients and normal controls was detected by qPCR. (B) The expression of circ_KCNQ5 in HS-5, Kasumi-1 and MV4-11 cells was detected by qPCR. (C and D) The effect of RNase R on the expression of circ_KCNQ5 and linear KCNQ5 was monitored by qPCR. (E and F) The effect of actinomycin D on the expression of circ_KCNQ5 and linear KCNQ5 was monitored by qPCR. (G and H) The distribution of circ_KCNQ5 in cytoplasmic RNA or nuclear RNA was determined by qPCR. *P < 0.05.
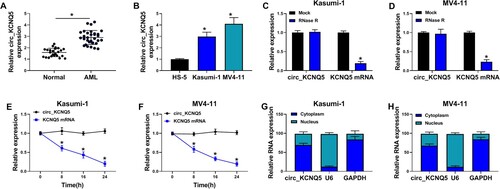
Figure 2. Circ_KCNQ5 knockdown suppressed AML cell proliferation and promoted cell apoptosis. (A and B) The expression of circ_KCNQ5 and KCNQ5 in Kasumi-1 and MV4-11 cells transfected with sh-circ_KCNQ5 or sh-NC was detected by qPCR. (C) The effect of circ_KCNQ5 knockdown on cell proliferation was assessed by colony formation assay. (D) The effect of circ_KCNQ5 knockdown on cell proliferation was assessed by EdU assay. (E and F) The effect of circ_KCNQ5 knockdown on cell proliferation was assessed by MTT assay. (G) The protein level of PCNA in Kasumi-1 and MV4-11 cells transfected with sh-circ_KCNQ5 or sh-NC was measured by western blot. (H) The effect of circ_KCNQ5 knockdown on cell apoptosis was assessed by flow cytometry assay. *P < 0.05.
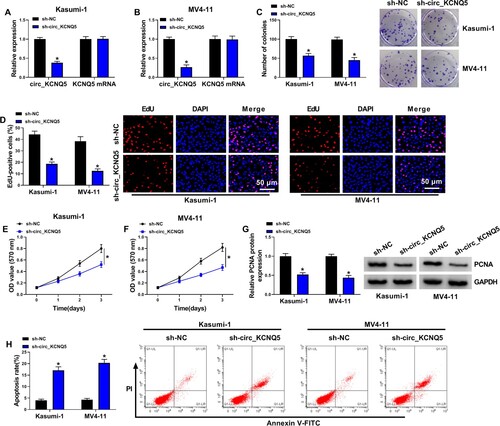
Figure 3. MiR-622 was a target of circ_KCNQ5. (A) The binding site between circ_KCNQ5 and miR-622 was predicted by circinteractome. (B and C) The binding between circ_KCNQ5 and miR-622 was verified by dual-luciferase reporter assay. (D) The expression of miR-622 affected by circ_KCNQ5 knockdown was detected by qPCR. (E) The expression of miR-622 in HS-5, Kasumi-1 and MV4-11 cells was detected by qPCR. (F) The expression of miR-622 in bone marrow samples from AML patients and normal subjects was measured by qPCR. (G) The linear relationship between circ_KCNQ5 expression and miR-622 expression in AML bone marrow samples. *P < 0.05.
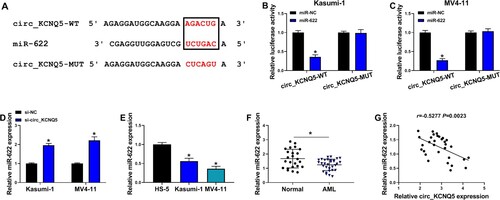
Figure 4. MiR-622 inhibition reversed the effects of circ_KCNQ5 knockdown. Kasumi-1 and MV4-11 cells were transfected with sh-circ_KCNQ5 alone or sh-circ_KCNQ5 + anti-miR-622. (A) The expression of miR-622 was measured by qPCR. (B-E) Cell proliferation in various cells was determined by colony formation assay, EdU assay and MTT assay. (F) The expression of PCNA in these cells was detected by western blot. (G) Cell apoptosis in these cells was detected by flow cytometry assay. *P < 0.05.
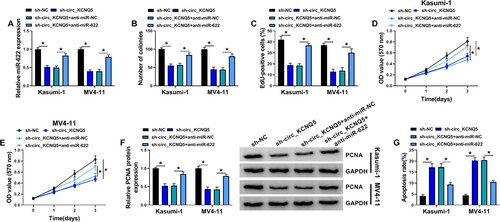
Figure 5. Circ_KCNQ5 regulated RAB10 expression by targeting miR-622. (A) The binding site between miR-622 and RAB10 3′UTR was predicted by miRDB. (B and C) The binding between miR-622 and RAB10 was verified by dual-luciferase reporter assay. (D) MiR-622 mimic or anti-miR-622 was used to mediate miR-622 overexpression or miR-622 downregulation. (E and F) The expression of RAB10 mRNA and protein affected by miR-622 overexpression or miR-622 downregulation was measured by qPCR and western blot. (G and H) The expression of RAB10 mRNA and protein in bone marrow samples from AML patients and normal subjects was detected by qPCR and western blot. (I and J) The linear relationship between RAB10 expression and miR-622 expression or circ_KCNQ5 expression in samples. (K and L) The expression of RAB10 mRNA and protein in HS-5, Kasumi-1 and MV4-11 cells was detected by qPCR and western blot. (M and N) The expression of RAB10 mRNA and protein in Kasumi-1 and MV4-11 cells transfected with sh-circ_KCNQ5 alone or sh-circ_KCNQ5 + anti-miR-622 was measured by qPCR and western blot. *P < 0.05.
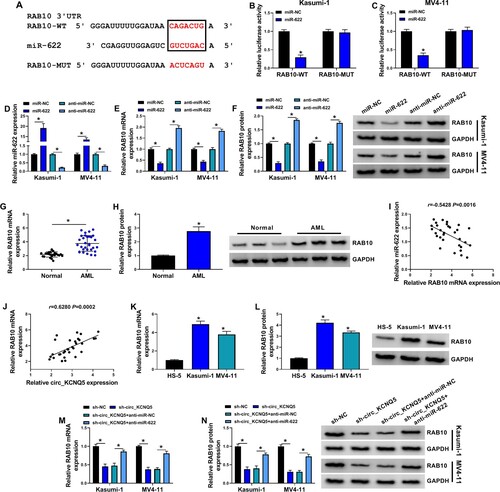
Figure 6. RAB10 overexpression abolished the effects of miR-622 restoration. Kasumi-1 and MV4-11 cells were transfected with miR-622 alone or miR-622 + RAB10. (A and B) The expression of RAB10 mRNA and protein in these cells was detected by qPCR and western blot. (C-F) Cell proliferation in various cells was determined by colony formation assay, EdU assay and MTT assay. (G) The expression of PCNA in these cells was detected by western blot. (H) Cell apoptosis in these cells was detected by flow cytometry assay. *P < 0.05.
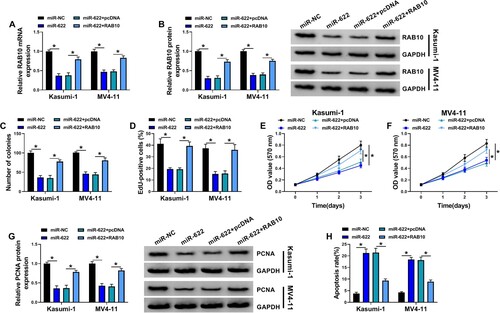
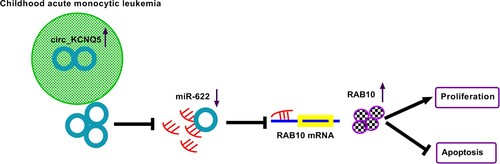
Figure 7. The main findings of the present study.