Figures & data
Figure 1 . NUP210 mRNA expression in patients with AML and healthy individuals
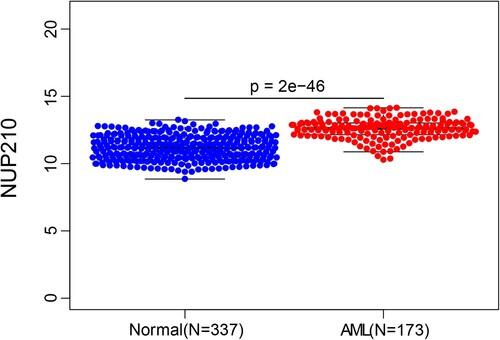
Figure 2. Subgroup analysis of NUP210 mRNA expression in patients with AML. (A) AML subtypes according to FAB classification; (B) sex; (C) age.
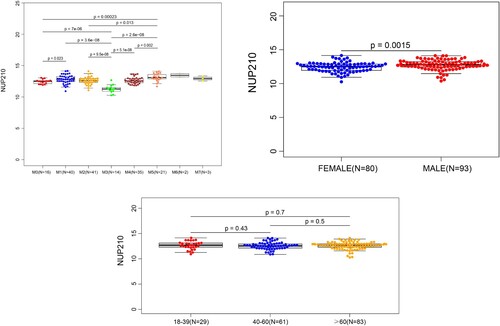
Table 1. Clinical characteristics of patients with AML in the NUP210-high and -low expression groups
Figure 3. Probability of survival for patients with AML in NUP210-high and NUP210-low expression groups. (A) All patients; (B) women; (C) men.
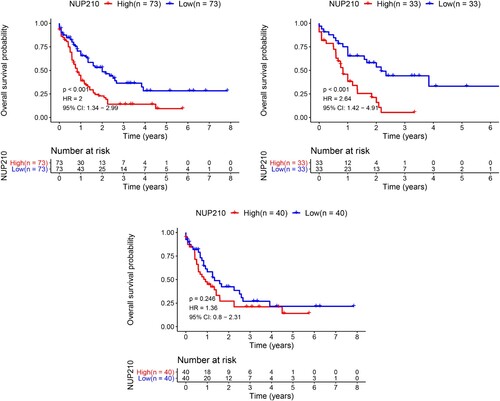
Table 2. Multivariate analyses of factors potentially affecting the overall survival of patients with AML.
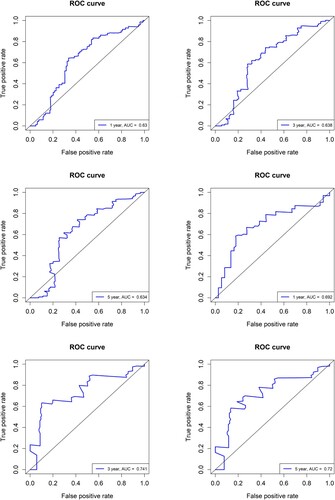
Figure 4. AUC analysis to assess the prognostic value of NUP210 expression in AML. (A–C) ROC curves for 1-year (A), 3-year (B), and 5-year (C) survival of all patients with AML; (D–F) ROC curves for 1-year (D), 3-year (E), and 5-year (F) survival of female patients with AML.