Figures & data
Figure 1. H22954 regulated the glycolysis in leukemia cells. (A) H22954 mRNA expressions in K562 cells stably transfected with the H22954-expressing plasmid vector were analyzed by qRT-PCR. (B) GC/MS analysis of lactic acid in the culture medium of K562 cells stably transfected with the H22954-expressing plasmid vector. Fold change meaning culture medium/uncultured medium. (C) 18F-FDG uptake assay showed that the glucose uptake in K562 cell lines with or without H22954-expressing plasmid.
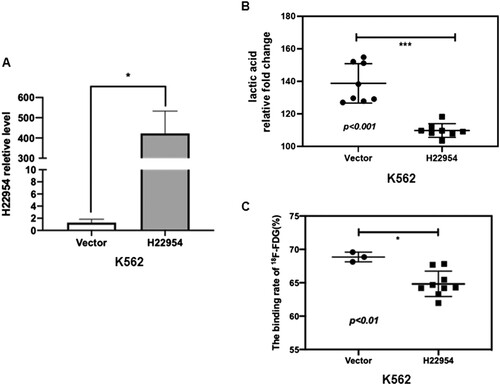
Figure 2. H22954 regulated the glucose uptake in NB4 and SHI-I cell lines. (A) H22954 mRNA expressions in NB4 cell lines stably transfected with the H22954-expressing plasmid vector were analyzed by qRT-PCR. (B) 18F-FDG uptake assay showed that the glucose uptake in K562 cell lines with or without H22954 overexpressing plasmid. (C) H22954 mRNA expressions in SHI-I cells with H22954 knockdown or control were analyzed by qRT-PCR. (D) 18F-FDG uptake assay showed that the glucose uptake in SHI-I cell lines with or without H22954 knockdown.
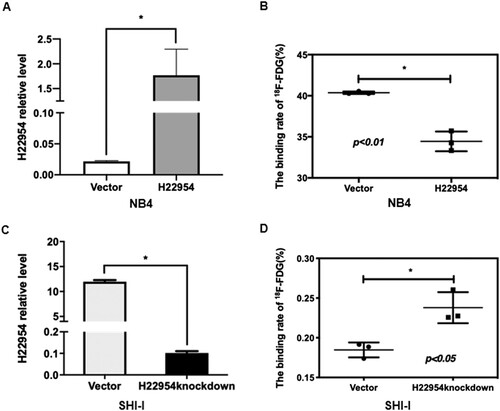
Figure 3. H22954 regulated the GLUT10 expression. (A) Hierarchical clustering of glucose transporter family genes expressed in individual K562 cells with the H22954-expressing plasmid or a vector. An individual sample was represented in each column and each row as a gene in the microarray. (B) GLUT10 mRNA expression in K562 cells with the H22954-expressing plasmid or a vector was analyzed by qRT-PCR. (C) GLUT10 mRNA expression in SHI-I cells with or without H22954 knockdown was analyzed by qRT-PCR. H22954 (D) and GLUT10 (E) mRNA levels in BMNCs from non-malignant controls (NMC) and newly diagnosed and untreated AML patients of M2 subtype were analyzed by qRT-PCR. The data were from the nonparametric analysis. All p values were <.05 vs. NC.
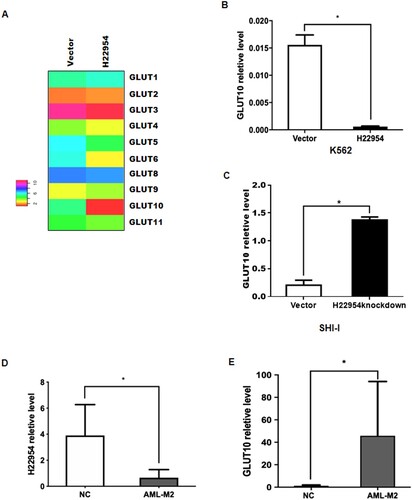
Figure 4. H22954 accelerated the GLUT10 mRNA degradation. H22954-expressing plasmids or a vector were transiently transfected into K562 cell lines. After 24 h, actinomycin D (5 μg/ml) were added. Total RNA was isolated at different time points. GLUT10 mRNA levels were analyzed by qRT-PCR and relative levels vs. at time 0 were calculated (n = 3).
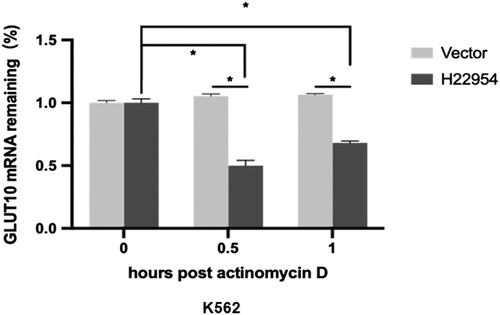
Figure 5. H22954 interacted with GLUT10 3′UTR. (A) Diagram of a H22954-targeting sequence in GLUT10 3′UTR. (B) Illustration of pGL3 plasmids with the luciferase (Luc) reporter gene and a mutant (pGL3-GLUT10 m) GLUT10 3′UTR sequence or a wild-type (pGL3-GLUT10). (C) Relative Luc activity in K562 cells transfected with pGL3-derived plasmids. p < .05 by Student's t-test (n = 3).
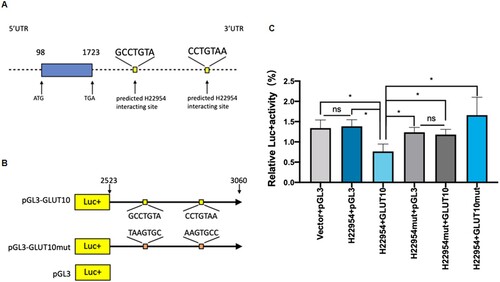
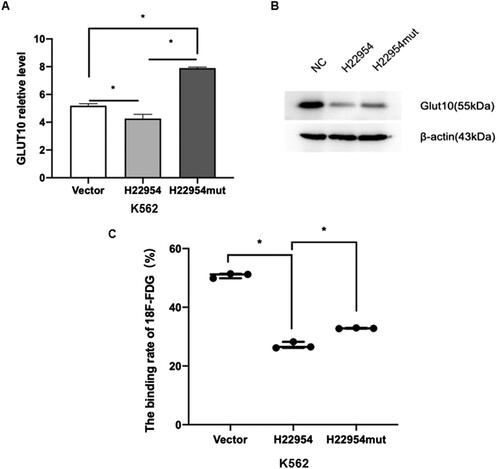
Figure 6. Blocking the interaction between H22954 and GLUT10 recovered glucose uptake in leukemia cells. (A) GLUT10 mRNA expression in K562 cells with the H22954-expressing plasmid, control vector, or H22954mut, which interact sites with GLUT10 mutant were analyzed by qRT-PCR. (B) Western blot analysis of GLUT10 expression in K562 cells with the H22954-expressing plasmid, control vector, or H22954mut, which interact sites with GLUT10 mutant. (C) 18F-FDG uptake assay showed that the glucose uptake in K562 cell lines with or without H22954-expressing plasmid and H22954mut which interact sites with GLUT10 mutant.