
Figures & data
Figure 1. Gene differentially expressed in T cells from CML patients and healthy donors. (A) The different gene expression profiles. Differentially expressed genes were selected based on a FC >1.5 or a FC <−1.5 with a p < 0.05. Red: Up-regulated genes; Blue: Down-regulated genes; Gray: other genes. The ‘limma' R package was used for analysis. (B) Heatmap of differentially expressed genes between CML patients and healthy donors. (C) KEGG signaling pathway enrichment analysis. White asterisks: Signaling pathways related to T cells. The ‘clusterProfiler' R package was used for analysis. (D) GO enrichment analysis. The ‘clusterProfiler' R package was used for analysis. The R (version 4.0.4) was used for analysis and graphics in this figure.
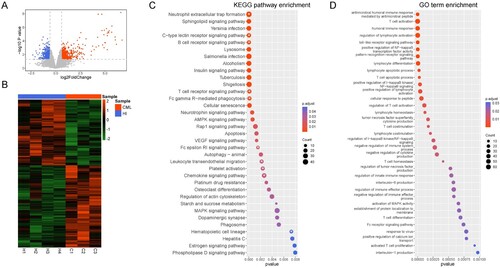
Figure 2. The different genes associated with T cell function in CD3+ T cells from CML patients and healthy donors. (A) The relationship between the different genes and T cell biological behaviors. The ‘GOplot' R package was used for graphics. (B) Heatmap of different genes related to the TCR signaling pathway. The R (version 4.0.4) was used for graphics in this figure.
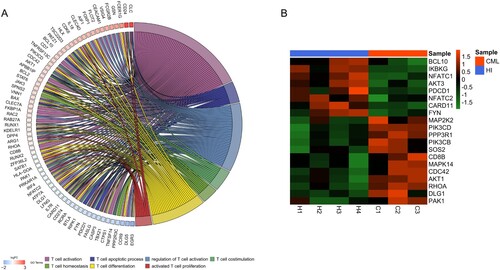
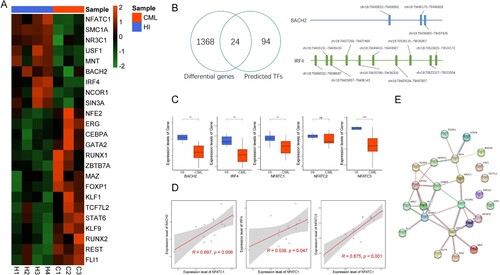
Figure 3. Expression of transcription factors that potentially regulate NFATC1 in CD3+ T cells from CML patients and healthy donors. (A) The expression of 24 transcription factors that may regulate NFATC1 in CML patients and healthy donors. (B) Left: Screening strategy for the 24 potential transcription factors; Right: The predicted genomic positions of the BACH2 and IRF4 that regulate NFATC1. (C) RT-qPCR results for BACH2, IRF4, NFATC1, NFATC2, NFATC3. Mean of two normally distributed variables was compared by independent samples Student’s test. The results are graphing the standard deviation. ** p < 0.01, **** p < 0.001. (D) Correlations between IRF4, NFATC3, BACH2 and NFATC1 from RT-qPCR results. The Pearson’s Correlation was used to analyze the linear relationship between each gene. (E) The interaction of NFATC1, IRF4 and BACH2 that is analyzed by PPI analysis. The R (version 4.0.4) was used for analysis and graphics in this figure.
Supplemental Material
Download MS Word (18.3 KB)Supplemental Material
Download MS Word (36.5 KB)Supplemental Material
Download MS Word (15.8 KB)Supplemental Material
Download JPEG Image (1.8 MB)
Data availability statement
The data that support the findings of this study are available from the corresponding author upon reasonable request.