
Figures & data
Figure 1. Flow diagram of MM patient enrollment and the study design.
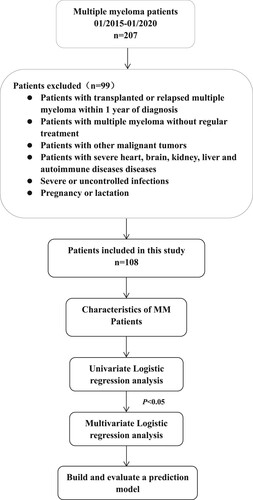
Table 1. Variable assignments.
Table 2. Characteristics of MM patients.
Table 3. Univariate logistic regression analysis.
Table 4. Multivariate logistic regression analysis.
Figure 2. ROC curve analysis diagram of prediction model validation.
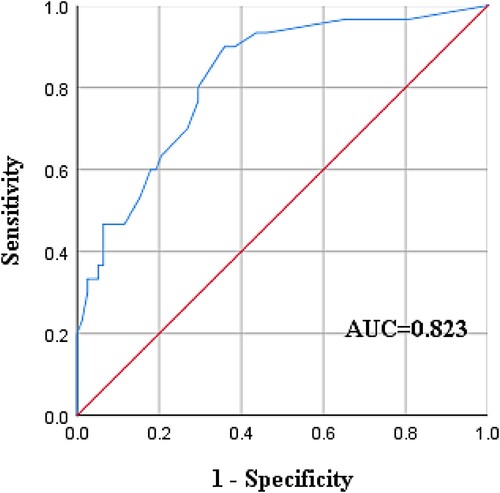
Table 5. Prediction model evaluated by the four-cell table.