
Figures & data
Table 1. Top 10 upregulated and top 10 downregulated DEmiRs in multiple myeloma.
Table 2. Downregulated DemiRs are associated with the enrichment of KEGG pathways. MicroT web server v5.0 [Citation22], and DIANA-TarBase v7.0 [Citation23] are used for identifying common pathways.
Figure 1. Construction of cluster-specific PPI of hub genes and cluster-specific pathway enrichment analysis. A. Hub genes of cluster 1 involved with PPI. B. KEGG pathways that are significantly associated with hub genes of cluster 1. C. Hub genes of cluster 2 involved with PPI. D. Three KEGG pathways are enriched in Cluster 2. E. PPI of hub genes in cluster 3. F. Three KEGG pathways are enriched associated with the hub genes of cluster 3. G-H. PPI of hub genes in cluster 4 and cluster 5.
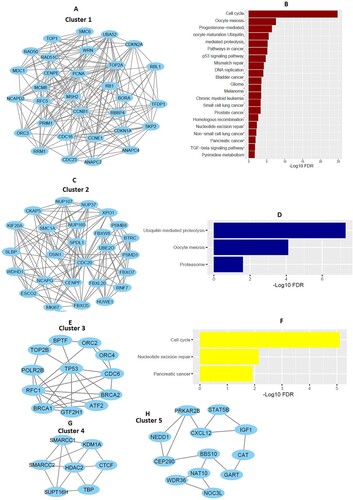
Table 3. MCODE identified hub gene-associated five significant clusters in MM.
Figure 2. Differentially expressed hub genes were targeted by DEmiRs. A. Identification of upregulated and downregulated hub genes. B. The upregulated 9 hub genes interact with downregulated DEmiRs. C. The downregulated 52 hub genes interact with upregulated DEmiRs.
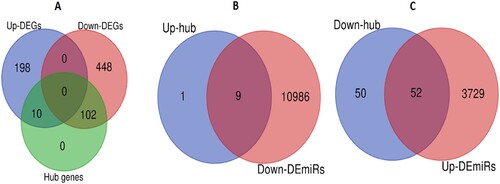
Figure 3. DEmiRs targeting hubs genes are associated with survival prognosis in multiple myeloma patients. Kaplan-Meier curves show that the expression of two hub genes (CDKN2A and TP53) correlates with survival prognosis (Disease-specific survival) in MM patients (log-rank test, P < 0.05).
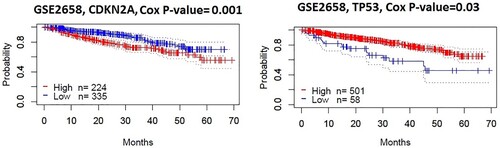
Figure 4. The expression level of CDKN2A is associated with the regulation of the tumor microenvironment in MM. A. Immune scores and microenvironment scores are negatively correlated with the expression levels of CDKN2A. B. Immune signatures are significantly correlated with the expression levels of CDKN2A.
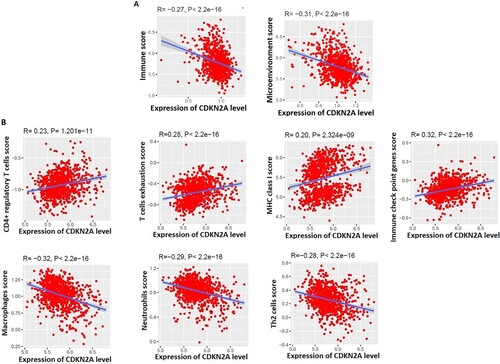
Figure 5. Positive correlation of CDKN2A with immunosuppressive markers in MM microenvironment. Immunosuppressive markers PDCD1 (PD-1), CTLA4, FOXP3, HHLA2, CD70, TMIGD2, TNFSF9, and IL5 are positively correlated with the expression levels of CDKN2A in the microenvironment of MM.
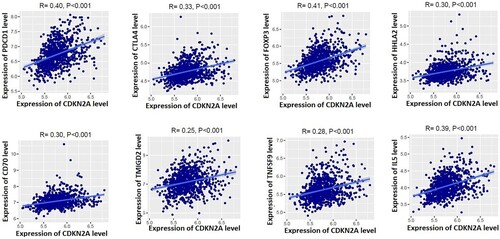
Figure 6. The expression validation of CDKN2A and its co-regulatory DEmiRs in the independent MM cohorts. A. The expression level of CDKN2A co-regulatory miRNAs: hsa-mir-492, hsa-mir-24, hsa-mir-192, and hsa-mir-10b are consistently downregulated in the GSE16558. B. The expression level of CDKN2A is consistently upregulated in the GSE16558 [Citation17] and GSE13591[Citation18].
![Figure 6. The expression validation of CDKN2A and its co-regulatory DEmiRs in the independent MM cohorts. A. The expression level of CDKN2A co-regulatory miRNAs: hsa-mir-492, hsa-mir-24, hsa-mir-192, and hsa-mir-10b are consistently downregulated in the GSE16558. B. The expression level of CDKN2A is consistently upregulated in the GSE16558 [Citation17] and GSE13591[Citation18].](/cms/asset/198fe93d-f48c-4f8b-baaa-4ed99303980d/yhem_a_2068873_f0006_oc.jpg)
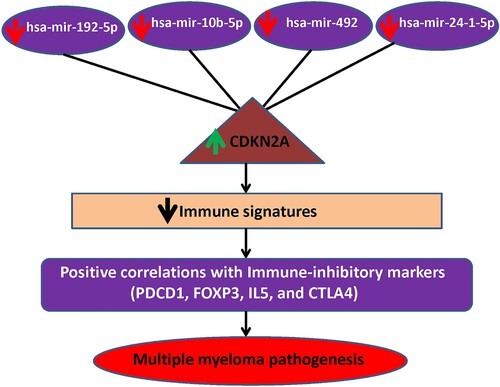
Figure 7. MiRNA-CDKN2A interactions in MM. The downregulation of miRNAs interacts with the upregulation of CDKN2A. This co-regulatory network is associated with the immunosuppressive TME of MM.
Supplemental Material
Download MS Word (12.1 KB)Supplemental Material
Download MS Word (13.8 KB)Supplemental Material
Download MS Word (40.2 KB)Supplemental Material
Download MS Word (13 KB)Supplemental Material
Download MS Word (21.8 KB)Supplemental Material
Download MS Word (21 KB)Data availability
The GEO datasets GSE125363, GSE125361, GSE47552, GSE2658, GSE136324, GSE16558, and GSE13591 used in this study are available in The National Biotechnology Information Center Gene (NCBI-Gene) database (https://www.ncbi.nlm.nih.gov/gene).