Figures & data
Table 1. Main characteristics of the 21 AML pediatric patients with t (v; 11q23)/KMT2A rearrangents.
Figure 1. The differences of the EFS, OS and CIR rates between the high-risk group and the medium-risk group were shown (P = 0.428, P = 0.398, P = 0.428).
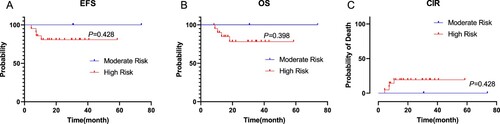
Figure 2. The differences in EFS, OS and CIR rates of children with full matched HSCT and haplo-HSCT were shown (P = 0.303, P = 0.289, P = 0.303).
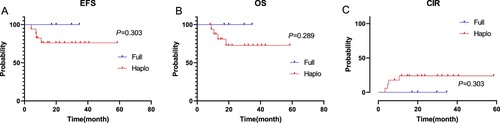
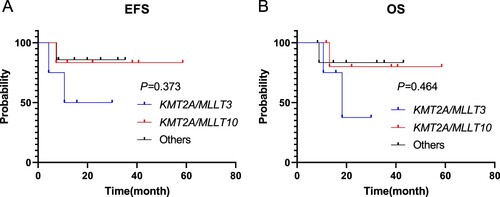
Figure 3. The differences in EFS, OS of children with KMT2A/MLLT3, KMT2A/MLLT10 and Others were shown (P = 0.373, P = 0.464).