Figures & data
Figure 1. RFC5 mRNA expression in acute myeloid leukemia. The RFC5 expression between tumor and normal samples from (A) GSE30029. (B) RFC5 expression distribution and survival status. (C) RFC5 expression in eight FAB AML subtypes. (D) RFC5 expression in different hematopoietic lineages.
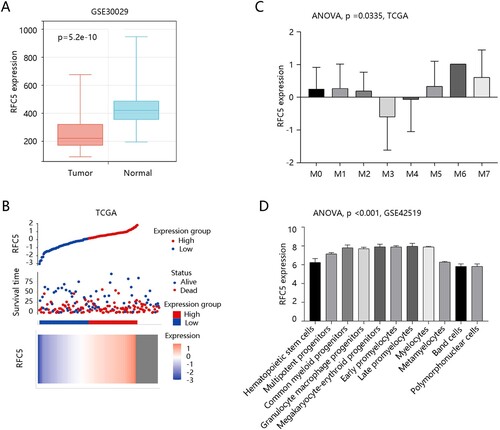
Table 1. Association of RFC5 expression with clinicopathological characteristics using logistic regression in the GDC TCGA cohorts.
Figure 2. The prognostic significance of RFC5 in acute myeloid leukemia. (A) High RFC5 expression predicts poor overall survival of patients using GDC TCGA-LAML data. (B) Verification of the prognostic value of RFC5 using the GSE10358 dataset. (C) Receiver operating characteristics curve using GDC TCGA-LAML data.
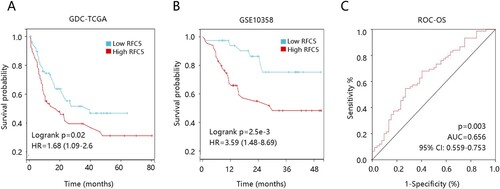
Table 2. Cox regression analysis of RFC5 expression and overall survival in the GDC TCGA cohorts.
Figure 3. Construction of nomogram. (A) Nomogram based on RFC5 and clinical characteristics. (B) The calibration curves.
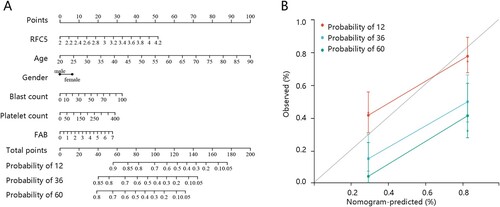
Figure 4. Identification of genes co-expressed with RFC5 and its functional enrichment analysis. (A) The volcano plot of the association result of RFC5. Top 50 genes that were positively (B) and negatively (C) related to RFC5. (D) Biological process. (E) Cellular components. (F) Molecular functions. (G) KEGG pathway.
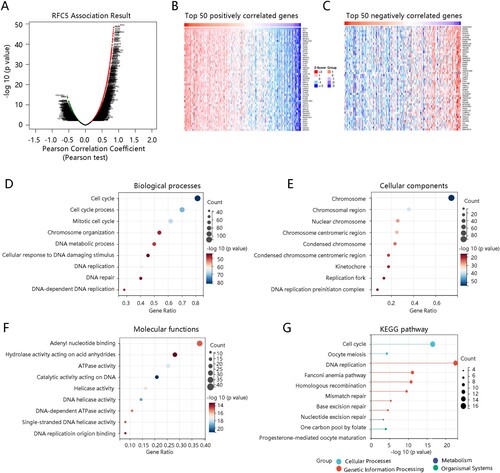
Figure 5. RFC5-related genes analysis. Interaction and biological process analyses of RFC5 and its related genes.
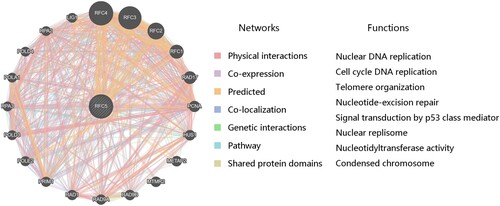
Figure 6. Enrichment plot from gene set enrichment analysis.
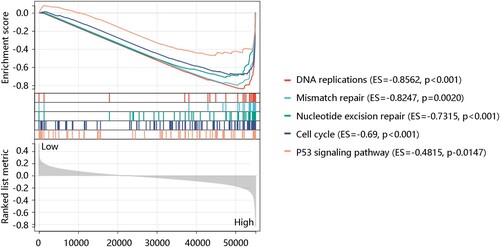
Table 3. Gene sets enriched in the high RFC5 expression phenotype.
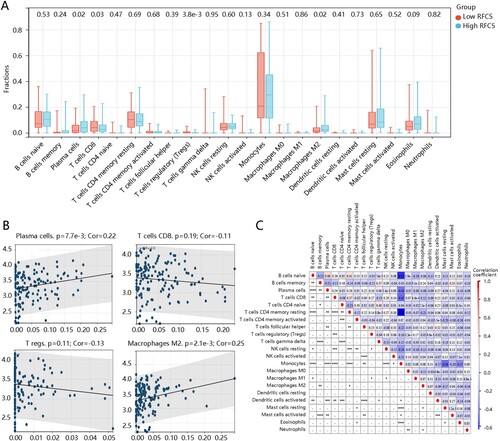
Figure 7. Correlation between RFRC5 mRNA expression and immune infiltration levels. (A) The varied proportions of 22 CIBERSORT immune cells between high and low RFC5 expression groups. (B) Correlation between RFC5 expression and plasma cells, T cells CD8, Tregs, and macrophages. (C) Heatmap of 22 immune infiltration cells in tumor samples.