Figures & data
Figure 1. Protein structure of α-syn. (A) α-syn is a highly conserved small protein, whose amino acid sequence consists of three domains: the N-terminal domain, the non-amyloid-β-component domain and the C-terminal domain; (B) Monomeric α-syn usually conforms into an α-helix structure; (C) Multiple forms of α-syn, among which the oligomer and the aggregated forms are usually pathogenic to brain tissues.
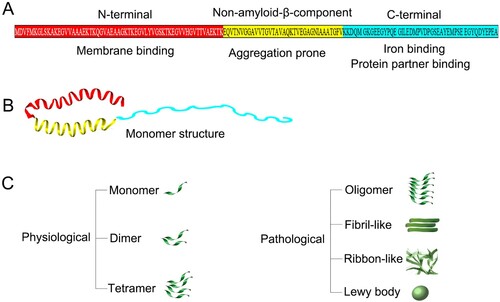
Figure 2. Differential expression of α-syn during human erythropoiesis. In culture of human CD34+ cells from peripheral blood, the α-syn gene starts transcription in the erythroid colony forming unit (CFU-E) stage and reaches peak levels in late stage of erythroblasts, whereas protein levels reach the highest in mature red blood cells.
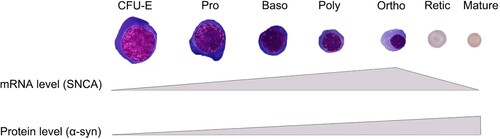
Figure 3. Differential expression of α-syn during mouse erythropoiesis. The Erythron DB Resource database classifies α-syn mRNA levels in four developmental stages. In primitive erythropoiesis, the levels of α-syn mRNA reaches its peak in the polyorthochromatic stage, while in fetal definitive and adult definitive erythropoiesis, the levels of α-syn mRNA are higher in late stage of erythroid cells (https://www.cbil.upenn.edu/ErythronDB/home.jsp).
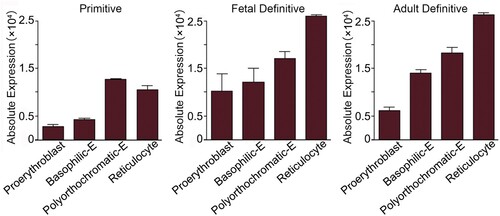
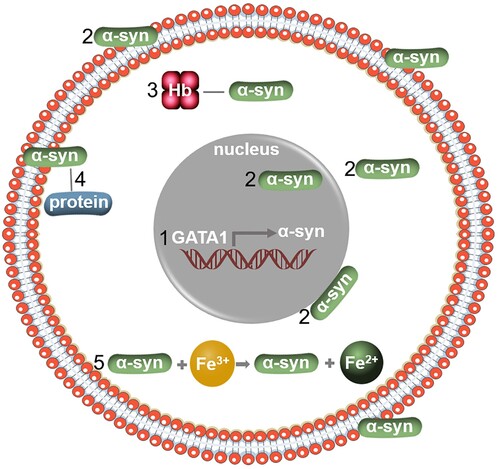
Figure 4. Expression and potential function of α-syn in erythroid cells. (1) α-syn can be transcribed by GATA1, a master transcription factor in erythroid cells; (2) Location of α-syn in erythroid cells; (3) α-syn binds to hemoglobin to form a protein complex; (4) α-syn acts as a chaperone to bind to other cellular proteins; (5) α-syn regulates iron homeostasis in erythroid cells.