Figures & data
Table 1. Patient characteristics.
Table 2. Characteristics of patients with HC.
Figure 1. Neutrophil and platelet engraftment probability of AA patients after HSCT. Neutrophil and platelet engraftment were compared between HC group and no HC group.(A) Neutrophil engraftment probability of patients after HSCT.(p = 0.08) (B)Platelet engraftment probability of patients after HSCT. (p = 0.03).
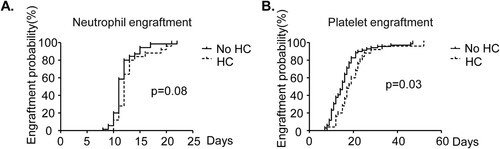
Figure 2. Lymphocyte subsets were not associated with HC. The frequency and counts of CD3+T cells, CD4+T cells, CD8+T cells,CD19+B cells and CD16+CD56+NK cells were detected by flow cytometry at D30 after HSCT. Lymphocyte subsets were compared between HC group and no HC group.(A)The frequency of CD3+T.(B) The counts of CD3+T cells.(C)The frequency of CD4+T cells.(D) The counts of CD4+T cells. (E)The frequency of CD8+T cells.(F)The counts of CD8+T cells.(G)The frequency of CD19+B cells.(H)The counts of CD19+B cells. (I)The frequency of CD16+CD56+ NK cells.(J)The counts of CD16+CD56+ NK cells.(K) The counts of total lymphocyte.
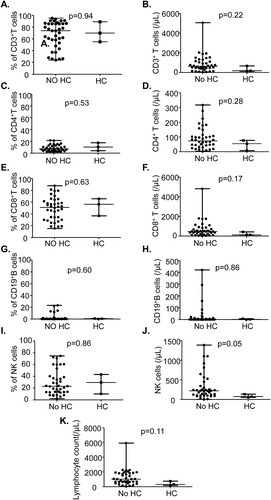
Figure 3. Receiver operating characteristic (ROC) curve of MNC for patients with and without HC. The cut off was calculated by the largest Youden's index (74% sensitivity, 58% specificity). The threshold of the MNC level is at 8.53×10⁸/kg.
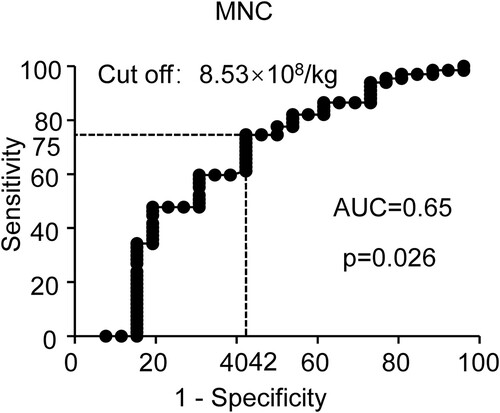
Figure 4. Cumulative incidence of engraftment syndrome in HC and no HC groups.
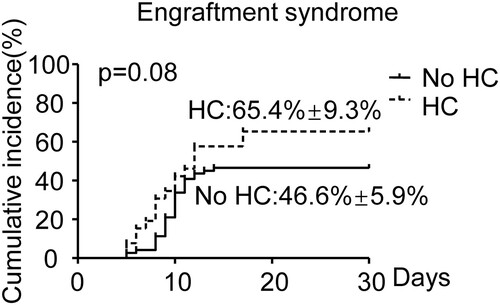
Figure 5. Cumulative incidence of aGVHD and cGVHD in HC and no HC groups. (A) Cumulative incidence of Grade I-IV aGVHD. (B) Cumulative incidence of Grade II-IV aGVHD. (C) Cumulative incidence of cGVHD. (D) Cumulative incidence of moderate and severe cGVHD.
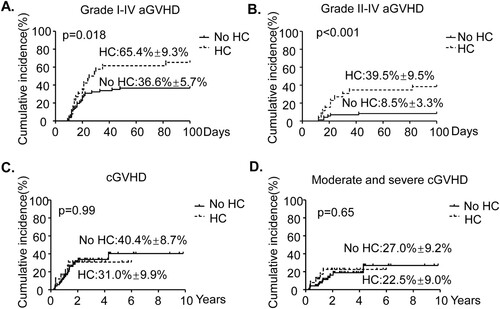
Table 3. Univariate analysis of HC in children with AA receiving HSCT.
Table 4. Multivariate analysis of HC in children with AA receiving HSCT.
Table 5. Validation analysis of HC in children with AA receiving MRD, HID and MUD.
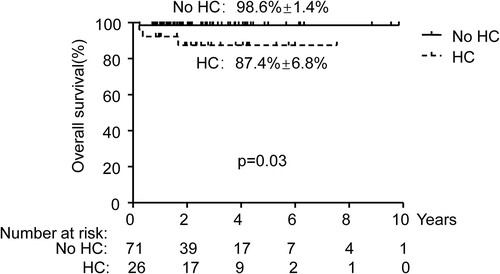
Figure 6. Overall survival of patients with and without hemorrhagic cystitis (HC).