
Figures & data
Table 1. The acute lymphocyte leukocyte CCLG-ALL 2008 program.
Figure 1. OS and EFS curves for 171 included children.
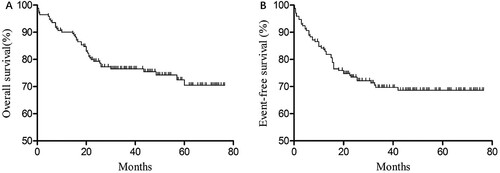
Table 2. Clinical and biological characteristics of the CD34+ and CD34− groups.
Figure 2. OS and EFS Kaplan–Meier curves for the CD34 + and CD34− groups. OS, EFS, and Kaplan–Meier curves for the CD34 + CD38+ and CD34 + CD38− groups.
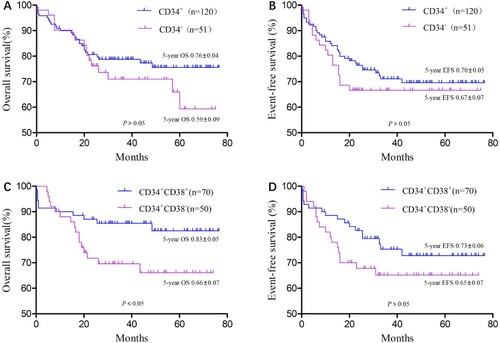
Figure 3. Recurrence curves for the CD34 + CD38+ and CD34 + CD38− groups at different stages.
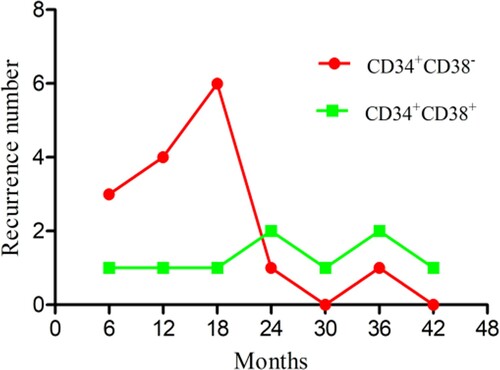
Figure 4. Kaplan–Meier curve of the recurrence rates between the CD34 + CD38+ and CD34 + CD38− groups.
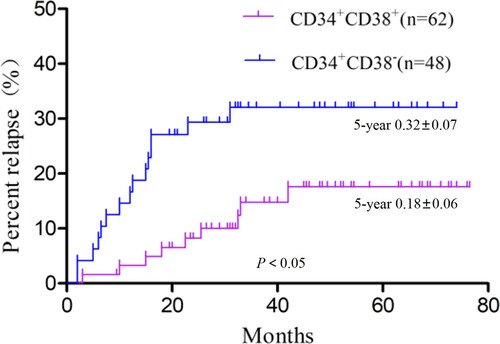
Figure 5. Kaplan–Meier curve of recurrence in the CD34 + CD38+ and CD34 + CD38− groups.
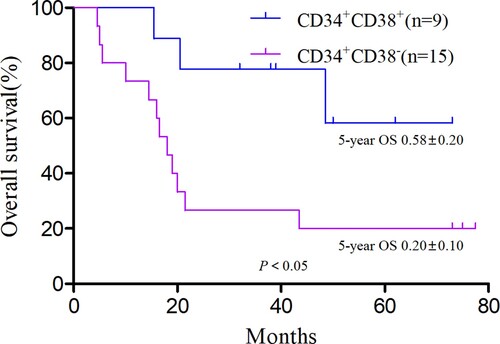
Table 3. Baseline comparison between the CD34 + CD38+ and CD34 + CD38− groups (before matching).
Table 4. Baseline comparison between the CD34 + CD38+ and CD34 + CD38− groups (after matching).