
Figures & data
Figure 1. (A) The prevalence of common thalassemia; (B) The prevalence of α-thalassemia, β-thalassemia, and concurrent α- and β-thalassemia; (C) The constituent ratio of α-thalassemia, β-thalassemia, and concurrent α- and β-thalassemia.
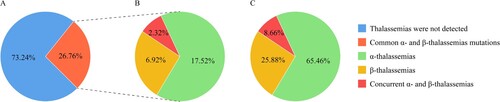
Table 1. Genotyping of α-thalassemia among people of reproductive age in the border area of Guangxi-Yunnan-Guizhou province, Southwestern China.
Table 2. Genotyping of β-thalassemia among people of reproductive age in the border area of Guangxi-Yunnan-Guizhou province, Southwestern China.
Table 3. Genotyping of concurrent α- and β-thalassemia among people of reproductive age in the border area of Guangxi-Yunnan-Guizhou province, Southwestern China.
Table 4. Forms of thalassemia for which fetuses would be at risk among couples in which both partners were positive for thalassemia in isotype among people of reproductive age in the Border Area of Guangxi-Yunnan-Guizhou province, Southwestern China.
Figure 2. Hematological characterization of α-thalassemia among different genders and genotypes. (A) MCV levels among participants with different genders and genotypes; (B) MCH levels among participants with different genders and genotypes; (C) Hb levels among participants with different genders and genotypes; (D) HbA2 levels among participants with different genders and genotypes; (E) HbF levels among participants with different genders and genotypes. # Males had significantly higher levels (p < 0.05) than females in the same genotypic group, * Males had significantly lower levels (p < 0.05) than females in the same genotypic group. P values for significant differences (p < 0.05) between genotypes of α-thalassaemia are shown. Non-listed comparisons are not significant.
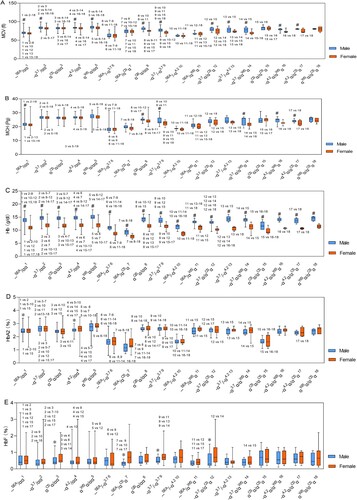
Table 5. Characteristics and hematological parameters of α-thalassemia among people of reproductive age in the border area of Guangxi-Yunnan-Guizhou province, Southwestern China, M (P25, P75).
Figure 3. Hematological characterization of β-thalassemia among different genders and genotypes. (A) MCV levels among participants with different genders and genotypes; (B) MCH levels among participants with different genders and genotypes; (C) Hb levels among participants with different genders and genotypes; (D) HbA2 levels among participants with different genders and genotypes; (E) HbF levels among participants with different genders and genotypes. # Males had significantly higher levels (p < 0.05) than females in the same genotypic group, * Males had significantly lower levels (p < 0.05) than females in the same genotypic group. P values for significant differences (p < 0.05) between genotypes of β-thalassaemia are shown. Non-listed comparisons were not significant. The HbA2% level of genotype βCD26/βN was the sum of HbA2% and HbE%, and was not compared with other genotypes.
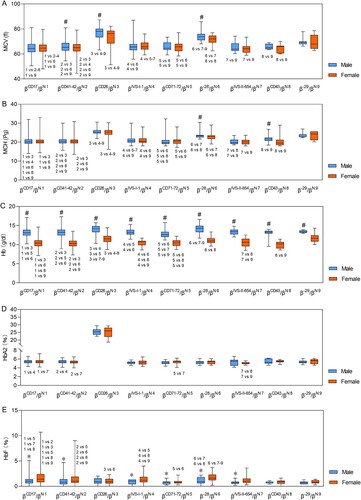
Table 6. Characteristics and hematological parameters of β-thalassemia among people of reproductive age in the border area of Guangxi-Yunnan-Guizhou province, Southwestern China, M (P25, P75).
Figure 4. Hematological characterization of concurrent α- and β-thalassemia among different genders and genotypes. (A) MCV levels among participants with different genders and genotypes; (B) MCH levels among participants with different genders and genotypes; (C) Hb levels among participants with different genders and genotypes; (D) HbA2 levels among participants with different genders and genotypes; (E) HbF levels among participants with different genders and genotypes. #Males had significantly higher levels (p < 0.05) than females in the same genotypic group; △Compared to β-thalassemia alone group in the same gender, concurrent α- and β-thalassemia group had significantly higher levels (p < 0.05); ⋆compared to α-thalassemia alone group in the same gender, concurrent α- and β-thalassemia group had significantly higher levels (p < 0.05). ▴Compared to β-thalassemia alone group in the same gender, concurrent α- and β-thalassemia group had significantly lower levels (p < 0.05); ★compared to the α-thalassemia alone group in the same gender, concurrent α- and β-thalassemia group had significantly lower levels (p < 0.05). Non-listed comparisons were not significant. The HbA2% level of genotype --SEA/αα/βCD26/βN was the sum of HbA2% and HbE%, and was not compared with other genotypes except, βCD26/βN.
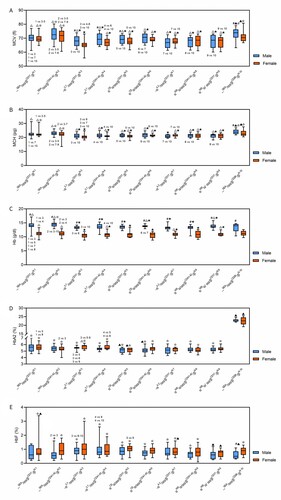
Table 7. Characteristics and hematological parameters of concurrent α- and β-thalassemia among people of reproductive age in the border area of Guangxi-Yunnan-Guizhou province, Southwestern China, M (P25, P75).