
Figures & data
Figure 1. Positron emission tomography computed tomography. (A) On presentation, showing disseminated hypermetabolic lymphadenopathy, pulmonary lesions, a huge nasopharyngeal mass (arrow), and splenomegaly with abdominal lymphadenopathy. (B) End-of-treatment, showing residual nasopharyngeal mass of reduced size and metabolic activity (arrows). (C) After four 21-day cycles of lenalidomide, with complete resolution of the nasopharyngeal mass. There was some residual lymphadenopathy (arrow) with metabolic activity lower than that of the liver.
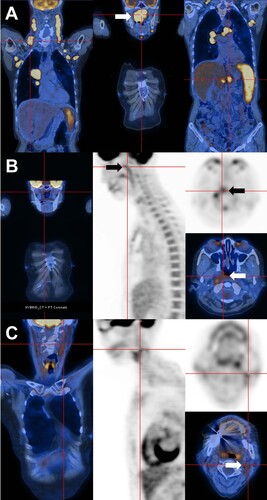
Figure 2. Histopathologic features. (A) Nasopharynegal biopsy on presentation, showing a polymorphic infiltrate of B-cells admixed with plasma cells and reactive T cells. The proportions of CD20-positive B-cells and CD138-positive plasma cells were about equal. Plasma cells showed lambda light chain restriction. In-situ hybridization for Epstein Barr virus encoded small RNA (EBER) showed numerous positive cells. Combined immunohistochemical staining and in situ hybridization showed that EBER expression was predominantly found in CD20-positive cells (original magnifications: hematoxylin eosin: 400; others: 200X). (B) Bone marrow biopsy on presentation, showing paratrabecular lymphoid infiltrates comprising predominantly CD20+ B-cells. CD138+ plasma cells were fewer, showing lambda light chain restriction. Different from the nasopharyngeal biopsy, there were only very few EBER+ cells (original magnifications: hematoxylin eosin: 800X; CD20: 400X; CD 138: 400X; kappa and lambda: 800X; EBER: 200X). (C) Nasopharyngeal biopsy after six courses of chemotherapy, showing a predominant mature-looking plasma cell infiltrate with very few CD3+ and CD20+ cells. Plasma cells were lambda light chain restricted. Practically no EBER+ cells were found (original magnification: hematoxylin eosin: 400X; others: 200X).
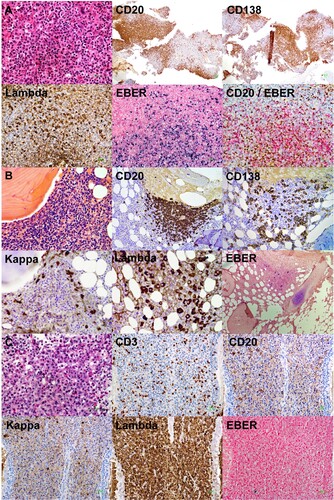
Figure 3. Evolution of laboratory parameters with treatment. On presentation, there were three paraproteins, two of which were quantifiable (immunoglobulin A lambda, IgAλ; immunoglobulin G kappa, IgGκ). EBV DNA was grossly elevated to > 104 IU/mL. After three cycles of O-CHOP (obinutuzumab, cyclophosphamide, adriamycin, vincristine, prednisolone), EBV DNA became undetectable. At the same time, paraprotein 1 had become undetectable. However, paraprotein 2 was still detectable after completion of six cycles of O-CHOP. With commencement of lenalidomide, paraprotein 2 gradually decreased, and became undetectable after 4 monthly cycles of lenalidomide. X axis (time) was the same for the paraprotein and EBV DNA.
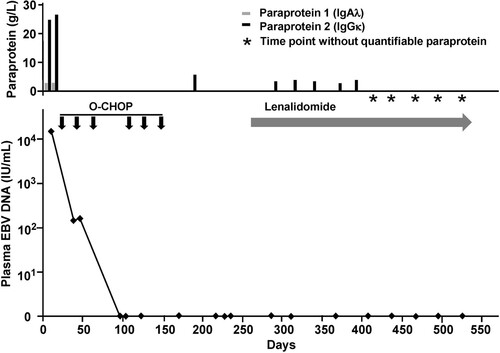
Figure 4. Polymerase chain reaction for IGH, IGK and IGL genes. The first and second nasopharyngeal biopsies showed identical amplification peaks.
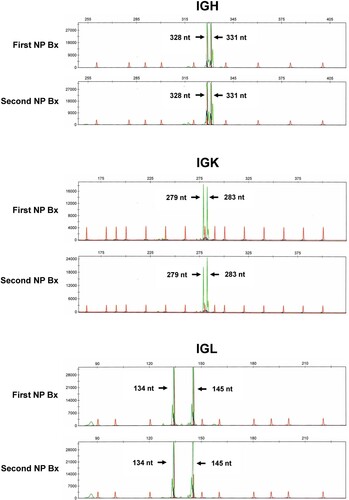
Table 1. Next generation sequencing of sequential nasopharyngeal biopsies of a case of immunodeficiency-associated B-cell lymphoproliferative disease (B-LPD).