
Figures & data
Table 1. Baseline patient, disease and treatment characteristics of sub-groups by infections during IsaPomDex (any grade infections vs. no infections).
Table 2. Infection episodes experienced during IsaPomDex treatment.
Table 3. Univariate and multivariate Poisson regression: all grade infections in the total cohort after a median of 4 IsaPomDex cycles.
Table 4. Univariate and multivariate Poisson regression: ≥G3 infections in the total cohort, after a median of 4 IsaPomDex cycles.
Table 5. Univariate logistic regression analysis: hospital admissions in the total cohort, after a median of 4 cycles of IsaPomDex.
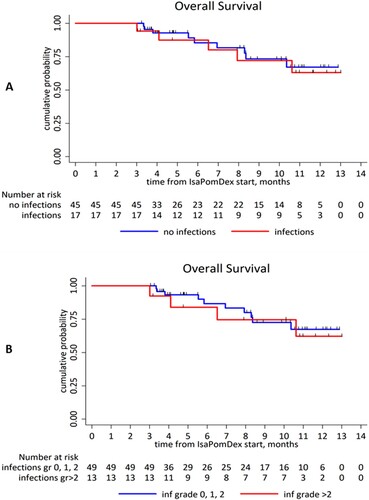
Figure 1. 3-month landmark analysis of overall survival (OS) according to infections in the first 3 months from starting IsaPomDex: (A) any grade infection vs. no infection, (B) ≥G3 infections vs. no infection.
Data availability statement
All available data relating to this report are presented in the manuscript and the accompanying tables.