Figures & data
Table 1. Primer sequences, the length of amplification products and annealing temperature.
Table 2. Hemostatic laboratory results.
Figure 1. Information of mutant FXII DNA. (a1) NM_000505.4:c.398-1G > A in case 1. (a2) NC_000005.10:g.7217_7221delinsGTCTA in case 1. (b1) NM_000505.4:c.398-1G > A in case 2. (b2) NP_000496.2:p.(Ser479Ter) in case 2. (c1) NP_000496.2:p.(Pro182Leu) in case 3. (c2) NM_000505.4:c.1681-1G > A in case 3. (d1) NP_000496.2:p.(Cys559Arg) in case 4. (n) showed normal.
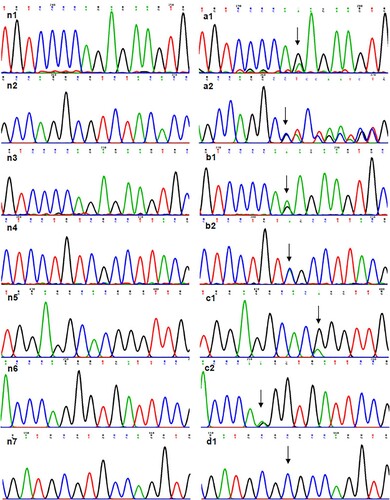
Table 3. Screening of the mutation site.
Figure 2. Conserved analysis of missense mutation site. (a) 182 P- FXII’s conservatism as the black arrow showed. (b) 559 C- FXII’s conservatism as the black arrow showed.
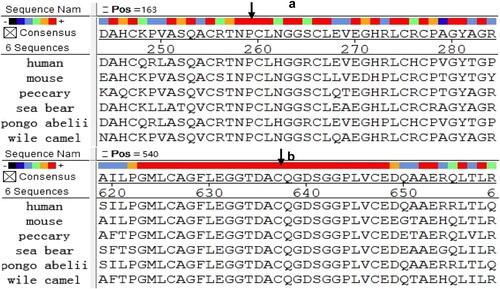
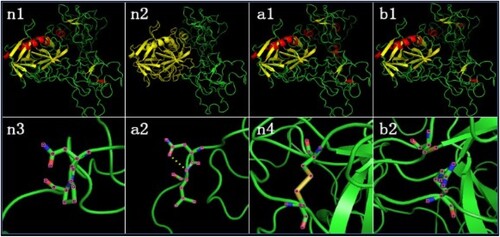
Figure 3. Predictive analytics of FXII protein structure. (n1) Wild-type FXII protein’s cartoon model n2 In wild-type FXII protein’s cartoon model, yellow represents light chain and green represents heavy chain. (a1) Mutant FXII (NP_000496.2:p.(Pro182Leu)) protein’s cartoon model. (b1) Mutant FXII (NP_000496.2:p.(Cys559Arg)) protein’s cartoon model. (n3) Local structure model of 181 N- FXII and 182 P- FXII in wild-type FXII protein. (a2) 162 N- FXII and 182 L- FXII built hydrogen bond in mutant FXII (NP_000496.2:p.(Pro182Leu)) protein. (n4) Disulfide bond between 559-C FXII and 590-C FXII in wild-type FXII protein. (b2) Disulfide bond between 559 and 590 disappeared in mutant FXII (NP_000496.2:p.(Cys559Arg)) protein.