Figures & data
Table 1. The hematological and molecular data of the family.
Figure 1. Hb analysis of the proband with Hb Jiangnan by HPLC and CE. HPLC showed an abnormal peak at retention time 4.49 min(A). CE demonstrated a high Hb X level (31.8%) in the Hb F Zone which were actually the sum of Hb X + Hb F(B).
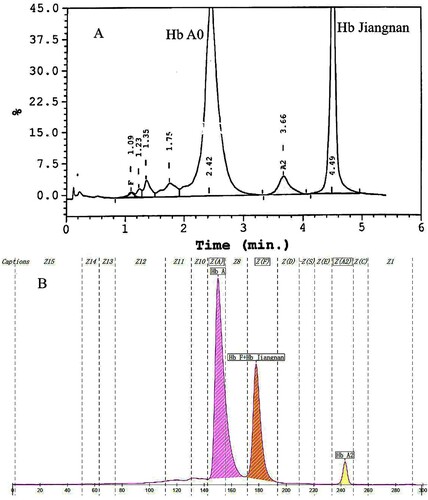
Figure 2. Hb analysis of the proband's wife using HPLC and his baby using CE. HPLC presented a Hb E co-eluted with Hb A2 at retention time 3.67 min in the proband’s wife (A). CE revealed normal results in his baby and there should be a small amount of Hb Jiangnan and Hb F that failed to separate (B).
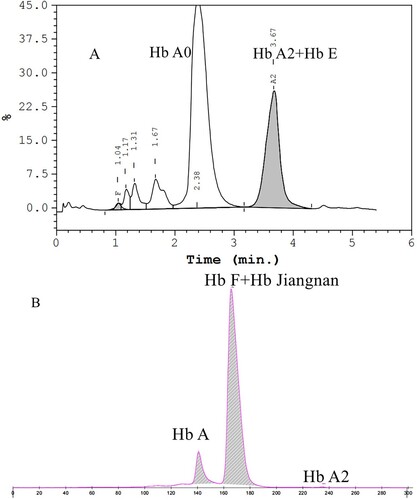
Figure 3. The results of the proband's wife showed the Hb E heterozygotes by PCR-RDB. No mutations were detected in the proband (A) but a Hb E heterozygote (arrow) was detected from the proband's wife (B).
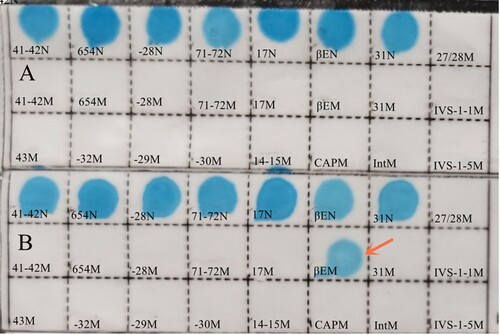
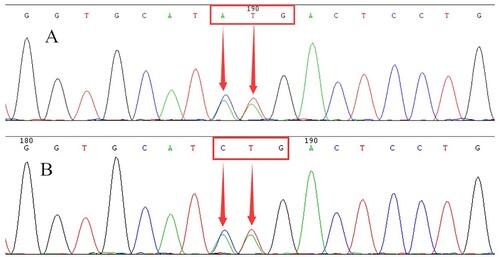
Figure 4. DNA sequencing of the proband (A) and his baby (B). They revealed a heterozygous CTG>AAG mutation at codon 3 of the β-globin gene (arrow).