
Figures & data
Table 1. Characteristics of the study subjects.
Figure 1. Comparison of the relative expression levels of miR-1246 in MM patients and healthy controls. The expression levels of miR-1246 in the peripheric blood samples of 90 MM patients and 30 health controls were measured by qPCR.
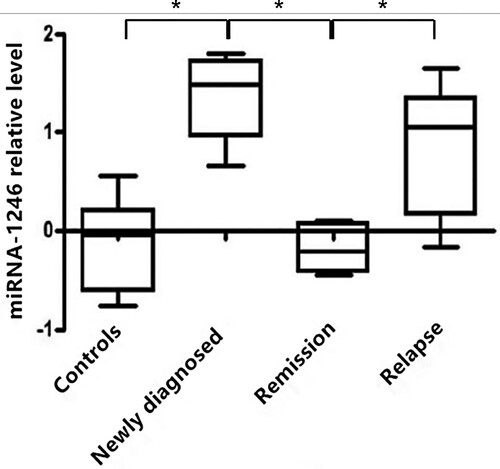
Table 2. Correlation between miR-1246 expression and clinical characteristics of MM patients.
Figure 2. ROC curve analysis of miR-1246 in peripheral blood. The diagnostic value of miR-1246 in MM patients was evaluated by constructing a ROC curve.
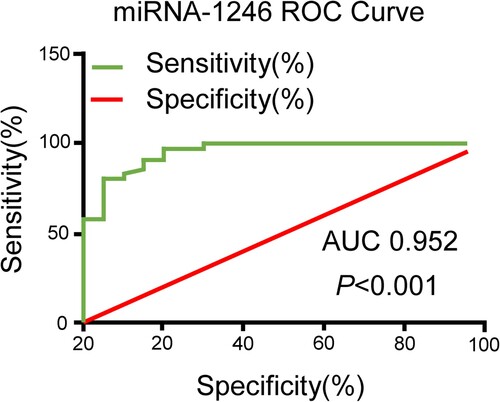
Figure 3. Positive expression of miR-1246 was associated with adverse prognosis of MM patients. Kaplan-Meier survival analysis revealed that miR-1246 expression was significantly associated with a shorter OS and PFS of MM patients.
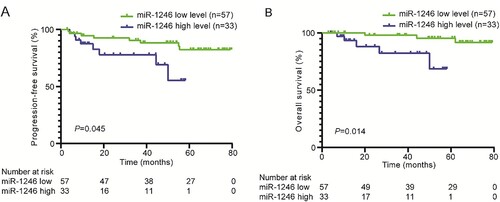
Table 3. Univariate analysis of PFS and OS risk factors in MM patients.
Table 4. Multivariate analysis of PFS and OS risk factors in MM patients.