
Figures & data
Figure 1. Flowchart of study population.
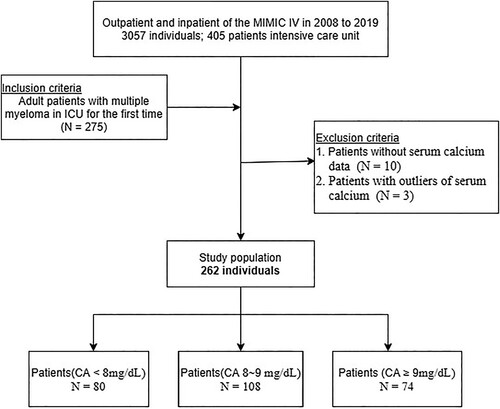
Table 1. Baseline demographic characteristics of the study population stratified by serum calcium.
Table 2. Association of covariates and in-hospital morality in patients with MM.
Table 3. Relationship between different serum calcium levels and in-hospital morality in different models.
Figure 2. The nonlinear relationship between serum calcium and in-hospital mortality in Multiple Myeloma in ICU. Adjusted for all covariates as model 2 (Calcium takes the upper limit of 98%).
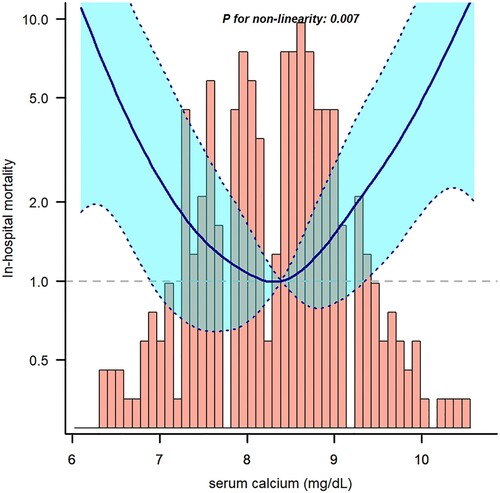
Table 4. Threshold effect analysis of serum calcium level and the in-hospital mortality of MM using Cox regression models.
Supplemental material