
Figures & data
Figure 1. Molecular characterization of -α3.7III deletion. (A) Gap-PCR analysis indicating a unique 1826bp product in the proband (XYL), her father (XSN) and her brother (XZT). –SEA/, heterozygous for –SEA; 1826 bp indicates the normal band, and 1306 bp indicates the SEA band. (B, C) Droplet digital PCR results showing the distribution of the positive and negative droplets (B), and the copy numbers of HBA1 and HBA2 in the proband (XYL) and her father (XSN) and brother (XZT). Blue droplets indicate positivity for HBA1 or HBA2, whereas green droplets represent RPP30, the reference gene used to calculate the copy number. Data are shown as mean ± SD.
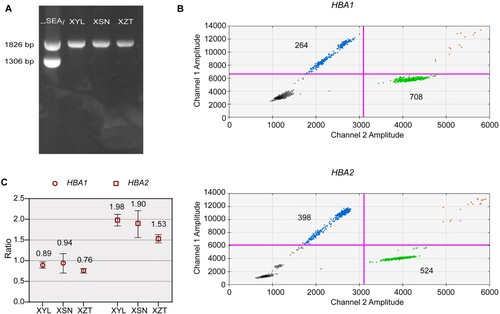
Figure 2. Sequencing analysis of the -α3.7III deletion. (A) Sanger sequencing results of -α3.7III in the proband. (B) SMRT analysis of the patient. The light yellow and blue regions indicate the two alleles of the α-globin gene cluster. The arrows show the region of the deletion. The purple dots indicate sequencing errors. The relative positions of the HBA2 and HBA1 genes on chromosome 16 are indicated by blue boxes. The vertical colored lines indicate nucleotides A (green), T (red), C (blue) and G (orange) discordant with alignment to hg38 reference sequence.
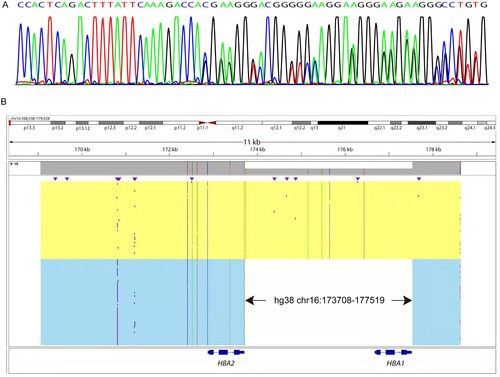
Table 1. The phenotypic and genotypic data of the proband and her families.
Data availability statement
All data in this study are shown in the figures and tables.