Figures & data
Figure 1. Alteration of Tfh/CD4+ T-cell ratio in patients with MM compared to that in HCs. (A-E) Schematic diagram of the flow cytometry analyses of CD4 + CXCR5 + T cell and CD25lowCD127intermediate-highTfh cells. (F) Flow cytometry analyses of CXCR3 + CCR6−Tfh1 cells, CXCR3−CCR6−Tfh2 cells, and CXCR3−CCR6 + Tfh17 cells. (G) Proportion of CD25lowCD127intermediate-highTfh/CD4+ T-cell in the peripheral blood of HCs and patients with MM (HCs vs MM: 90. 95 ± 0.97% vs 86.48 ± 2.19%, P = 0.1762).
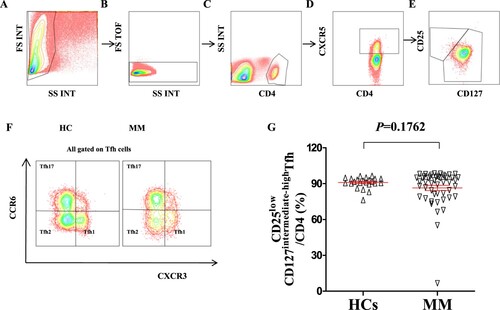
Figure 2. Alteration of Tfh cell subsets in patients with MM compared to that in HCs (A) The proportion of CXCR3 + CCR6−Tfh1/Tfh, CXCR3−CCR6−Tfh2/Tfh, and CXCR3−CCR6 + Tfh17/Tfh in the peripheral blood of HCs and patients with MM. CXCR3 + CCR6−Tfh1/Tfh (HCs vs MM: 19.71 ± 1.10% vs 20.79 ± 1.27%, P = 0.5924); CXCR3−CCR6−Tfh2/Tfh (HCs vs MM: 43.27 ± 1.11% vs 32.54 ± 1.27%, P < 0.0001); CXCR3−CCR6 + Tfh17/Tfh (HCs vs MM: 31.92 ± 0.71% vs 39.22 ± 1.17%, P = 0.0001). HCs: Healthy controls (n = 23); MM: Multiple myeloma (n = 49).
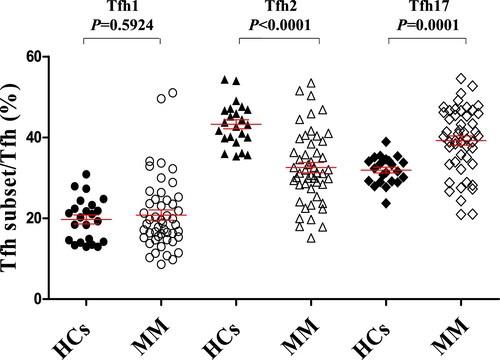
Figure 3. Alteration of Tfh cell subsets in newly diagnosed patients and relapsed patients with MM compared to that in HCs (A) CXCR3 + CCR6−Tfh1/Tfh median percentage (HCs vs Newly diagnosed vs Relapsed: 19.71 ± 1.10% vs 19.07 ± 1.64% vs 16.03 ± 2.24%, P = 0.2513); CXCR3−CCR6−Tfh2/Tfh (HCs vs Newly diagnosed vs Relapsed: 43.27 ± 1.11% vs 37.24 ± 2.20% vs 30.61 ± 3.03%, P < 0.0001); CXCR3−CCR6 + Tfh17/Tfh (HCs vs Newly diagnosed vs Relapsed: 31.92 ± 0.71% vs 37.68 ± 1.68% vs 45.19 ± 1.91%, P = 0.0001). HCs: Healthy controls (n = 23); Newly diagnosed MM (n = 12); Relapsed patients with MM (n = 10).
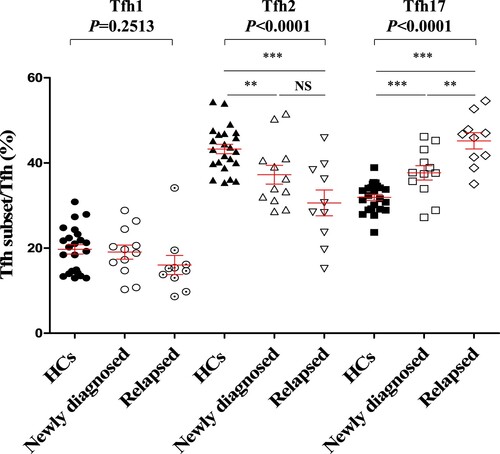
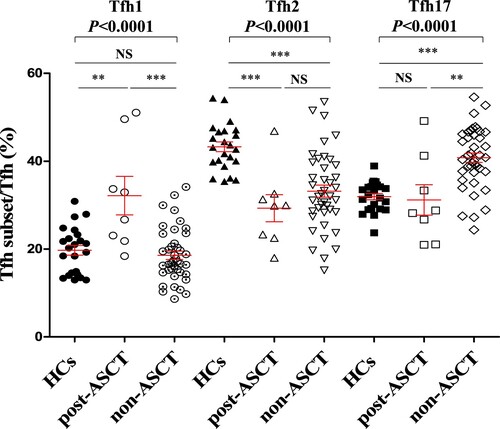
Figure 4. Alteration of Tfh cell subsets in post-ASCT and non-ASCT patients with MM compared to that in HCs. CXCR3 + CCR6−Tfh1/Tfh median percentage (HCs vs post-ASCT vs non-ASCT: 19.71 ± 1.10% vs 32.15 ± 4.37% vs 18.58 ± 0.95%, P < 0.0001); CXCR3−CCR6−Tfh2/Tfh median percentage (HCs vs post-ASCT vs non-ASCT: 43.27 ± 1.11% vs 29.29 ± 3.09% vs 33.18 ± 1.39%, P < 0.0001); CXCR3−CCR6 + Tfh17/Tfh median percentage (HCs vs post-ASCT vs non-ASCT: 31.92 ± 0.71% vs 31.17 ± 3.46% vs 40.79 ± 1.08%, P < 0.0001). HCs: Healthy controls (n = 23); post-ASCT (n = 8); non-ASCT (n = 41).