
Figures & data
Table 1. Basic clinical characteristics of all research subjects.
Figure 1. Comparison of miR-448 expression levels among the healthy control group, newly diagnosed group, remission group and refractory group (***P < 0.001).
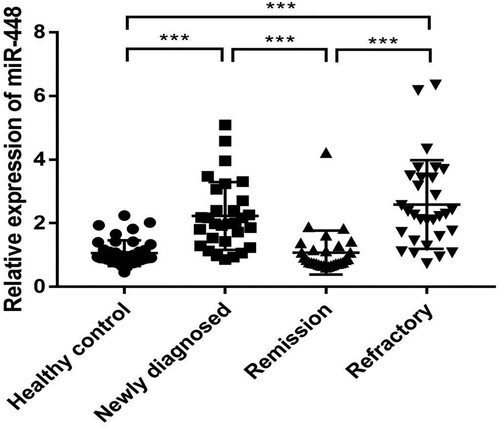
Table 2. Association of miR-448 expression and clinical characteristics in newly diagnosed MM patients.
Figure 2. The correlation of miR-448 with PC (A), MP (B), Hb (C), β2-MG (D), Alb (E) and Ca2+ (F). PC = plasma cells; MP = M protein; Hb = hemoglobin; β2-MG = β2-microglobulin; Alb = albumin; Ca2+ = calciumion.
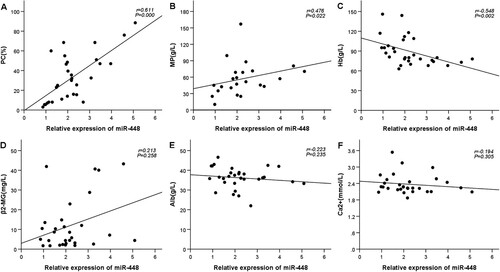
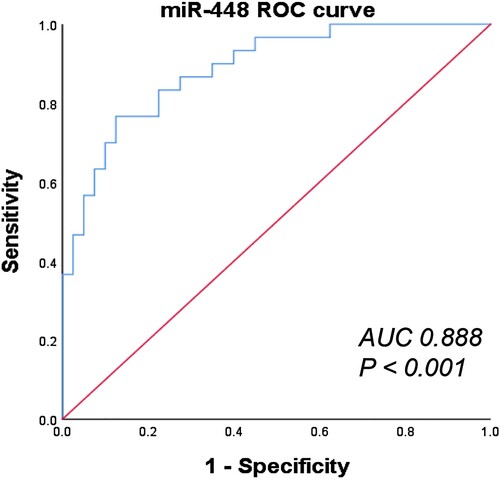
Figure 3. ROC curve analysis of miR-448 expression in the plasma of multiple myeloma patients and healthy controls.
Data availability statement
The data used to support the findings of this study are available from the corresponding author upon request.