
Figures & data
Figure 1. PRISMA Flow Diagram of the contributors of von Willebrand factor to clinical severity of sickle cell disease: a systematic review (1998-2020).
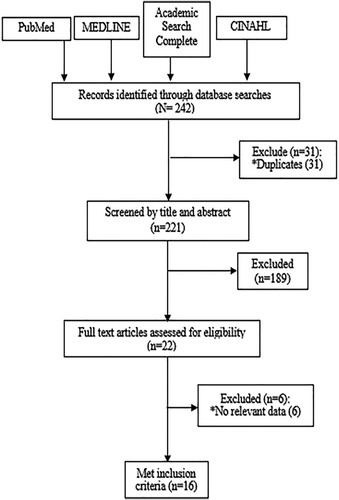
Figure 2. Forest plot comparing VWF levels in patients with SCD and control.
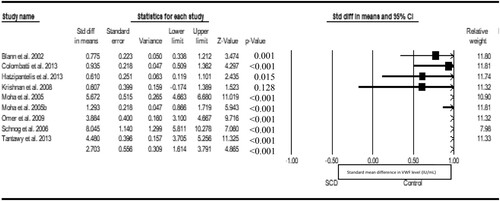
Figure 3. Forest plot showing the correlation between VWF and vasoocclusive crisis.
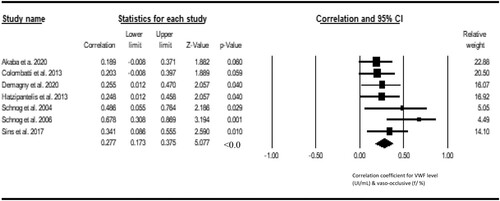
Figure 4. Forest plot showing the correlation between VWF and hemolysis rate.
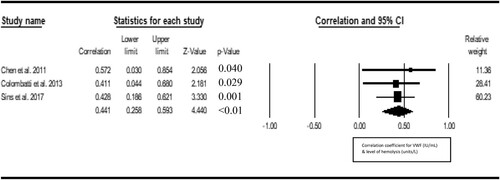
Figure 5. Forest plot showing the correlation between VWF and fetal hemoglobin.
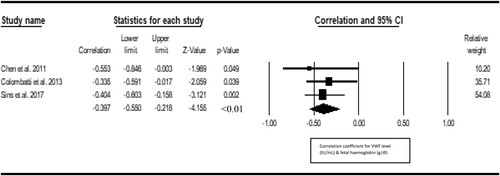
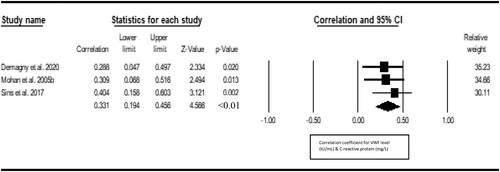
Figure 6. Forest plot showing the correlation between VWF and the C-reactive protein.
Supplemental material