
Figures & data
Table 1. Clinicopathological characteristics of AML patients from TCGA database.
Figure 1. The results of mutation status and differential expression analyses in AML patients in TCGA database. (A) The top 20 genes with the highest mutation rates in AML patients. (B) TMB distribution value. X-axis: TMB value; Y-axis: log10(TMB). (C) Volcano plot of DEGs. X-axis: Log2FC; Y-axis: −log10(P adjust); blue: upregulated genes; red: downregulated genes. (D): Heat map of DEGs. X-axis: samples; Y-axis: various genes; red: highly expressed genes; blue: lowly expressed genes; green: upregulated genes; purple: downregulated genes.
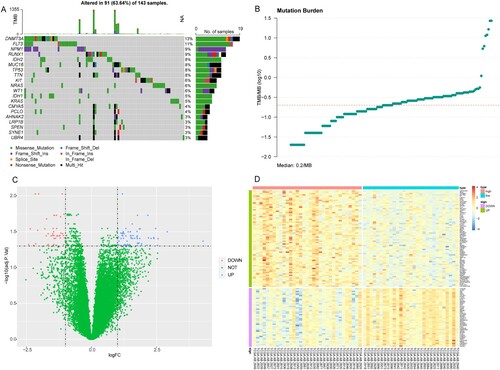
Figure 2. Functional enrichment results. (A) The top 20 most significantly enriched GO terms. (B) The top 20 significantly enriched KEGG pathways. X-axis: the number of genes enriched; Y-axis: the names of the terms.
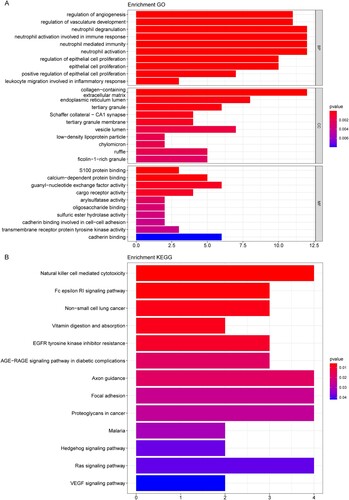
Figure 3. The AML patients cluster results based on the DEGs. (A) The ‘elbow diagram’ to determine the optimal number of clusters. X-axis: the number of clusters K; Y-axis: the sum of the squared errors (SSE). The optimal number k = 2. (B) The AML samples clustering. (C) Kaplan-Meier survival curve. X-axis: time; Y-axis: survival probability. P was determined by log-rank test.
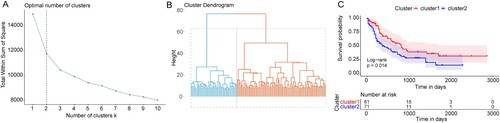
Figure 4. Construction of the prognostic model for AML. (A) The top 20 genes most significantly related to the prognosis of AML. HR: Hazard ratio; 95% CI: 95% confidence interval. (B) The optimal lambda value in LASSO Cox regression analysis. X-axis: log (lambda); Y-axis: partial likelihood Deviance. (C and D) Survival curves of AML patients in TCGA and GEO databases. X-axis: time; Y-axis: survival probability. P was determined by log-rank test.
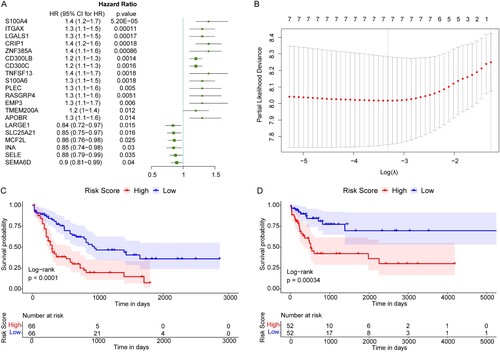
Figure 5. The Risk score was an independent prognostic marker of AML. (A) Multivariate Cox regression analysis results. Compared with reference samples, patients with HR >1 had a higher risk of death. (B and C) Survival curves of female and male AML patients. (D and E) Survival curves of AML patients of ≤55 years old and >55 years old. X-axis: time; Y-axis: survival probability. P was determined by log-rank test.
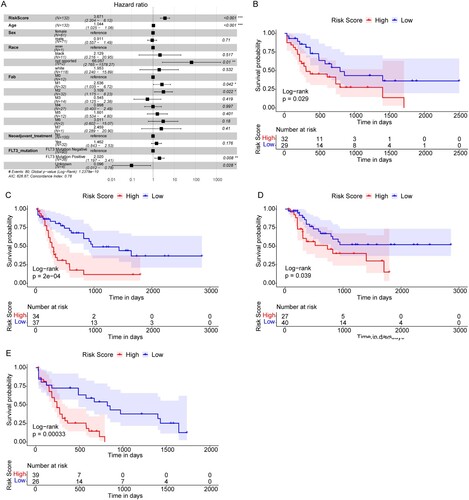
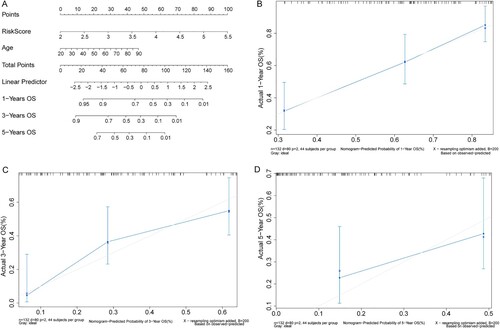
Figure 6. Nomogram could predict the OS of AML patients. (A) Nomogram model. (B–D) The calibration curves of Nomogram predicting the OS of AML patients in one, three, and five years. X-axis: predicted probability; Y-axis: actual probability.
Supplemental Material
Download Zip (68 KB)Data availability statement
Our data and related clinical information were retrieved from The Cancer Genome Atlas (TCGA, https://tcga-data.nci.nih.gov/tcga/) and the Gene Expression Omnibus (GEO, https://www.ncbi.nlm.nih.gov/geo/, accession number: GSE71014).