
Figures & data
Table 1. The correlation of circ_0003489 expression with the clinicopathological characteristics in 40 MM patients.
Table 2. Primer sequences used for RT-qPCR.
Figure 1. Expression characteristics of circ_0003489 in MM. (A) Circularstructure of circ_0003489, (B and C) The abundance of circ_0003489 in MM tissues and cells was assessed, (D and E) Oligo (dT)18 primer was used to explore whether circ_0003489 had poly-A tail, (F and G) Circ_0003489 and CDK8 levels were detected after actinomycin D treatment, (H and I) Subcellular localization analysis was performed to detect circ_0003489 expression in cell nucleus and cytoplasm. *P < 0.05.
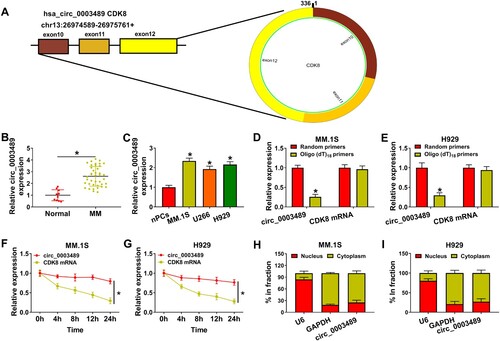
Figure 2. Effect of circ_0003489 silencing on MM cell function. (A) Sh-circ_0003489#1 and sh-circ_0003489#2 knockdown efficiency was analyzed. Sh-circ_0003489#1 and sh-NC were transfected into MM.1S and H929 cells, (B) cell viability, (C and D) cell cycle, (E) proliferation, (F) apoptosis, (G and H) Ki67, MMP2 and Bax protein levels were measured. *P < 0.05.
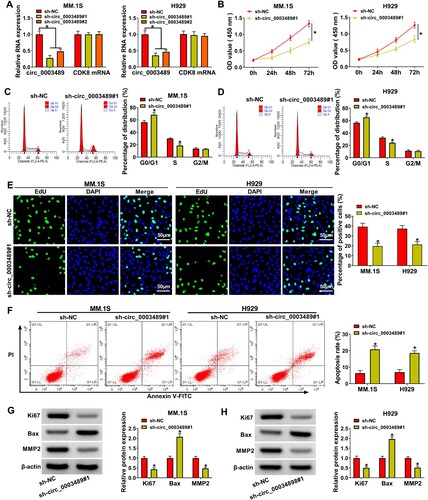
Figure 3. The relationship between circ_0003489 and miR-433-3p was verified. (A) Downstream targets of circ_0003489 were predicted, (B) Dual-luciferase reporterassay was analyzed to screen the targeted miRNA for circ_0003489, (C) Complementary binding sequence between circ_0003489 and miR-433-3p, (D) The overexpression efficiency of miR-433-3p mimic was determined, (E and F) Dual-luciferase reporter assay was employed to analyze the relationship between circ_0003489 and miR-433-3p, (G) RNA pull down assay was employed to analyze the relationship between circ_0003489 and miR-433-3p, (H) The abundance of miR-433-3p in MM tissues was measured and (I) Correlation analysis of circ_0003489 and miR-433-3pabundance in MM tissues, (J) Determination of miR-433-3p abundance in MM cells. *P < 0.05.
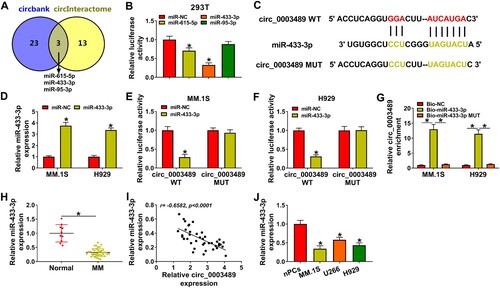
Figure 4. MiR-433-3p upregulation regulated MM progression. MiR-433-3p mimic and miR-NC were transfected into MM.1S and H929 cells, respectively. (A) CCK8 assay was employed to analyze cell viability, (B and C) Cell cycle was analyzed using flow cytometry assay, (D) EdU assay was used to assess MM cell proliferation, (E) MM cell apoptosis was analyzed by flow cytometry assay and (F) Ki67, MMP2 and Bax protein levels were determined using western blot. *P < 0.05.
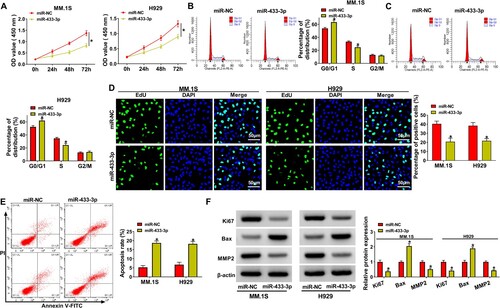
Figure 5. PBX3 and miR-433-3p targeting relationship was validated. (A) The complementary sequences of miR-433-3p and PBX3, (B and C) PBX3 and miR-433-3p targeting relationship was validated using dual-luciferase reporter assay, (D) PBX3 and miR-433-3p targeting relationship was validated using RNA pull down assay, (E) The abundance of PBX3 in MM tissue was analyzed, (F and G) Correlation analysis of PBX3 level with miR-433-3p and circ_0003489 levels in MM tissues, (H and I) PBX3 protein level in MM tissues and cells were measured, (J) The silencing effect of anti-miR-433-3p was analyzed and (K) The protein level of PBX3 was determined in MM.1S and H929 cells transfected with miR-433-3p mimic or inhibitor. *P < 0.05.
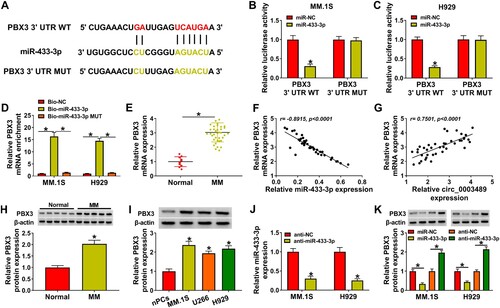
Figure 6. PBX3 protein level was co-regulated by circ_0003489 and miR-433-3p. (A–D) The sh-NC, sh-circ_0003489#1, sh-circ_0003489#1 + anti-NC, sh-circ_0003489#1 +anti-miR-433-3p were transfected into MM.1S and H929 cells, respectively. The mRNA and protein levels of PBX3 were analyzed. *P < 0.05.
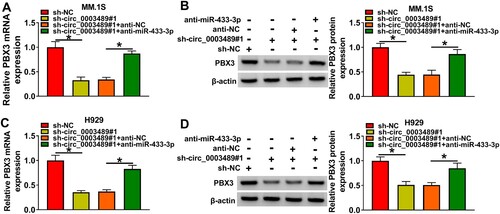
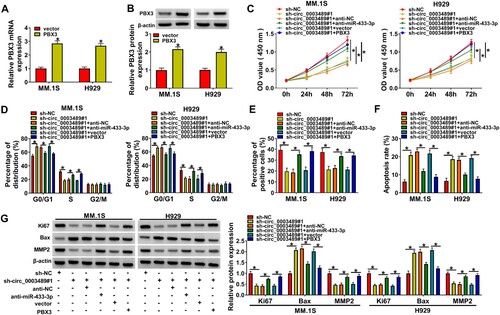
Figure 7. Circ_0003489/miR-433-3p /PBX3 axis regulated MM cell function. (A and B) The efficiency of PBX3 overexpression vector was determined. The sh-NC, sh-circ_0003489, sh-circ_0003489 + anti-NC, sh-circ_0003489 + anti-miR-433-3p, sh-circ_0003489 + vector, sh-circ_0003489 + PBX3 were transfected into MM.1S and H929 cells, (C) Cell viability, (D) cell cycle, (E) proliferation, (F) apoptosis and (G) Ki67, MMP2 and Bax protein levels were measured. *P < 0.05.
Data availability statement
The datasets used and analyzed during the current study are available from the corresponding author on reasonable request.