
Figures & data
Table 1. Sample characteristics of seven survey cycles data extracted from NHANES between 2005 and 2018.
Table 2. The general anemia prevalence and treatment rates across seven survey cycles.
Figure 1. The anemia weighted prevalence from 2005 to 2018 by subgroups: (a) age group, (b) sex, (c) race, (4) education, (5) poverty income ratio, (f) birthplace. The error bars represent the standard errors obtained by Taylor series linearization.
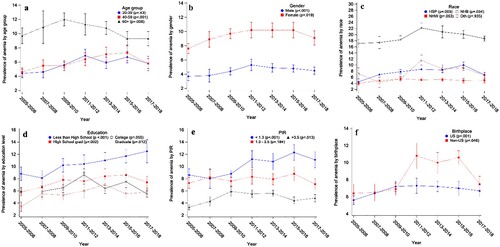
Table 3. Multiple logistic regression models for anemia status as the dependent variable.
Figure 2. The anemia treatment rates from 2005 to 2018 by subgroups: (a) age group, (b) sex, (c) birthplace, (d) insurance. The error bars represent the standard errors obtained by Taylor series linearization.
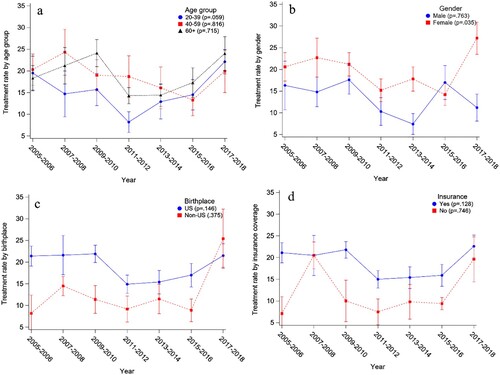
Table 4. Multiple logistic regression models for anemia treatment as the dependent variable.
Data availability statement
The data used in this study can be downloaded from NHANES websites: https://www.cdc.gov/nchs/nhanes/index.htm. Code availability: The code used in this study is available upon request.