Figures & data
Table 1. Information on mouse grouping.
Figure 1. The weight changes of mice from day +1 to day +22. All model mice had lower weight than the group NC, model group vs. group NC, p < 0.01. However, there were no significant differences among model groups.
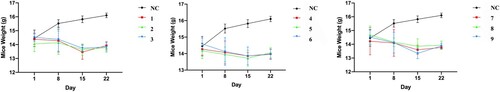
Figure 2. Peripheral blood routine of mice among groups on days +1, +8, +15, +22. Data were presented as mean ± standard error of the mean. *p .05, **p
.01 vs. group NC. WBC, white blood cell count; HGB, hemoglobin count; PLT, platelet count; RET, the ratio of reticulocytes.
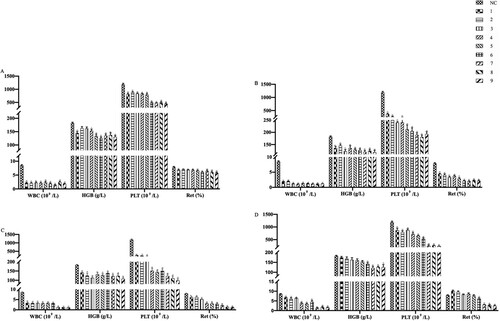
Table 2. Peripheral Blood cell count in mice.
Table 3. Correlation analysis between WBC, HGB, PLT, RET and radiation dosage.
Figure 3. Comparison of Th17 and Treg cells among groups at day +22 after the establishment of the aplastic anemia model. Th17 cells were marked with CD4 and IL17 antibodies, while Treg cells were marked with CD4, CD25 and Foxp3 antibodies. Cells division was measured by flow cytometry. The rate of Th17 and Treg cells was presented by the histogram, respectively. Data were expressed for 10 groups as mean ± standard error of the mean (n = 3). *p .05 vs. group NC, **p
.01 vs. group NC.
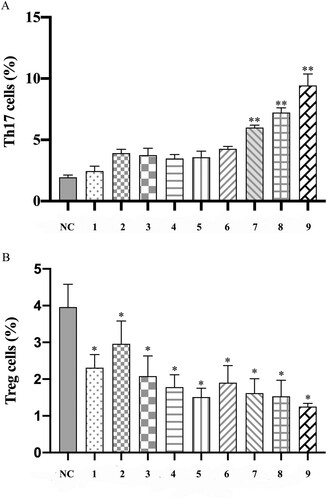
Figure 4. The rate of Th17 and Treg cells on flow cytometry. (A) The total splenic lymphocytes were gated, chose the CD4+ T cell in it. Based on the CD4+ T cell, chose the IL17+ cells (Th17 cells: CD4 + IL17+ cells) with a rectangular gate among each group. (B) The total splenic lymphocytes were gated, chose the CD4+ CD25+ T cells in it. Then, choosing the Foxp3+ cells regarded as Treg cells (CD4+CD25+Foxp3+ cells) from CD4+ CD25+ T cells with rectangular gate among each group.
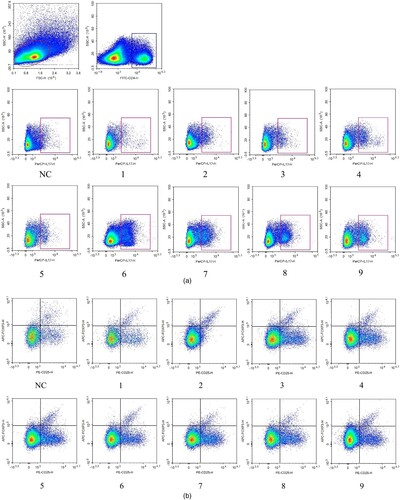
Table 4. Rate of Th17 and Treg cells among groups.
Figure 5. Morphological changes of bone marrow. Hematoxylin-eosin-stained bone marrow sections were observed under an inverted microscope and photographed at 200 magnification. Karyocytes were stained blue with hematoxylin, while erythrocyte and bone trabecula were stained red with eosin. The system, including granulocytes, erythrocytes, megakaryocytes and lymphocytes, was regarded as hematopoietic tissue; meanwhile, bone trabecula, bone and adipose tissue belonged to the non-hematopoietic tissue.
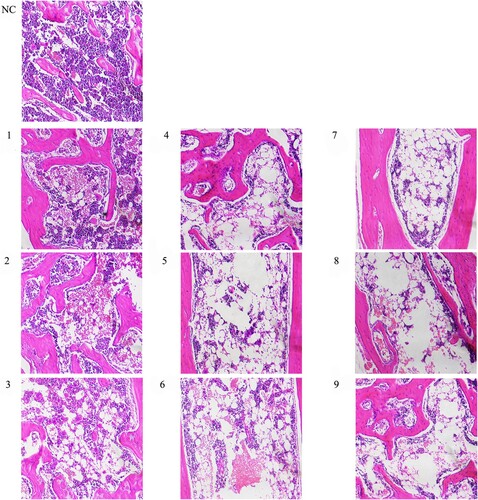
Figure 6. Comparison of the area of hematopoietic tissue among groups on day +22. ImageJ was used to recognize and calculate the area percentage of hematopoietic tissue in total medullary space. Data were presented as mean ± standard error of the mean (n = 3). *p .05 vs. group NC, **p
.01 vs. group NC.
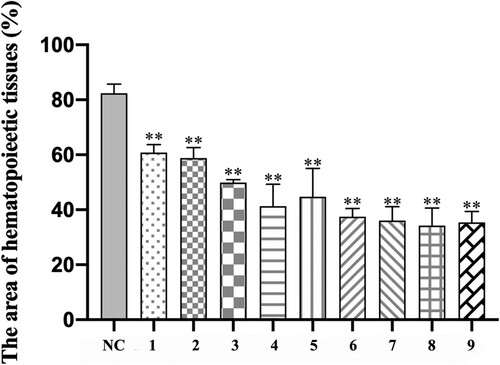
Figure 7. Bone marrow biopsy stained with CD34 (200 magnification). The arrow shows positive cells, which are hematopoietic stem or progenitor cells. The cytoplasm of cells marked CD34 was brown, while the cell nucleus of karyocytes was blue. The CD34 positive cells and mass had diffuse distribution in group NC. However, the CD34 positive cells had scattered distribution and positive cell mass was rare in group 4 Gy. Obviously, from group 4.5 Gy to group 5 Gy, the frequency of positive cells gradually decreased.
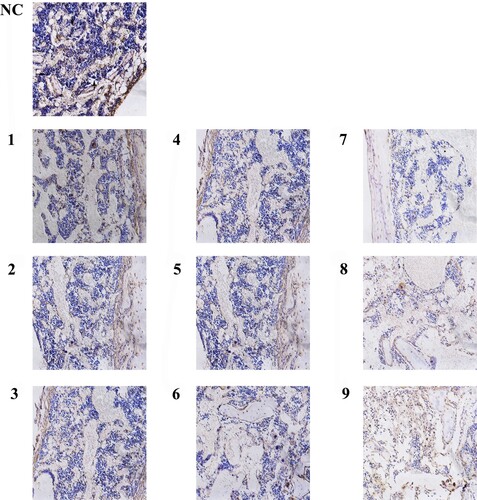
Figure 8. Bone marrow biopsy stained with CD41 (200 magnification). The arrow shows positive cells which are megakaryocytes and platelets. The cytoplasm of cells marked CD41 was brown, while the cell nucleus of karyocytes was blue. The CD41 positive cells were larger and had scattered distribution in group NC. However, the positive cells decreased obviously in group 4 Gy. Moreover, the positive cells were found hardly in group 4.5 Gy, while even were not observed in group 5 Gy.
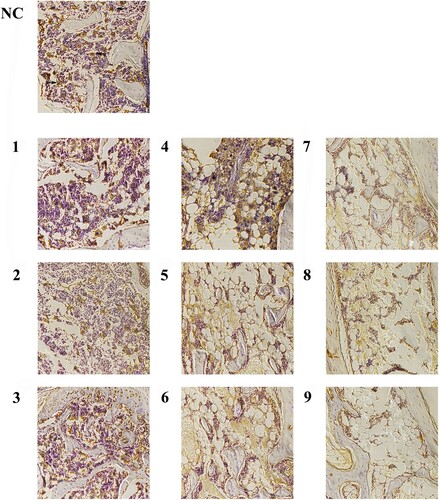
Figure 9. Comparison of CD31 and CD41 cells count in bone marrow biopsy sections among groups. The positive cells stained by the immunohistochemistry technique were counted on day +22. (A) The histogram of CD34 + cell counts among groups. (B) The histogram of CD41+ cell counts among groups. Data were presented as mean ± standard error of the mean (n = 9). *p .05 vs. group NC, **p
.01 vs. group NC.
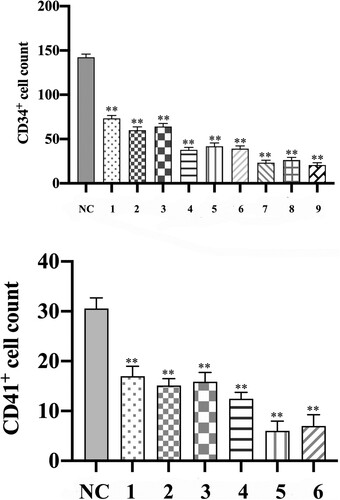
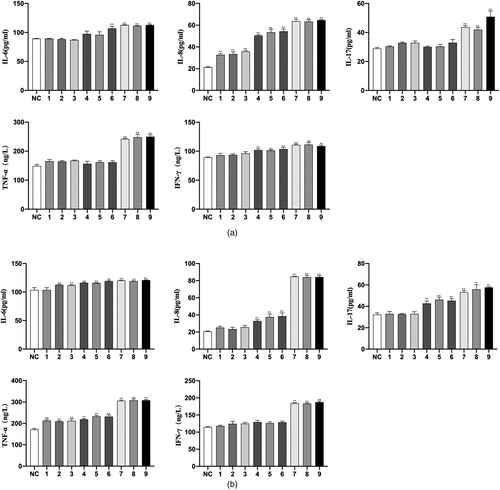
Figure 10. The level of IL-6, IL-8, IL-17, TNF-α and IFN-γ. (a) The cytokines in peripheral blood. (b) The cytokines in bone marrow. Data were presented as mean ± standard error of the mean (n = 3). *p < 0.05 vs. group NC, **p < 0.01 vs. group NC.