
Figures & data
Table 1. Five year average net survival rates for children with cancer in 2015–2019 by world region.Table Footnotea
Figure 1. Dual energy X ray absorptiometry of Total Body Less Head.
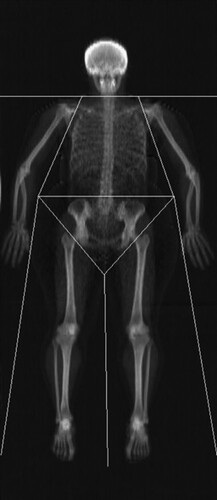
Table 2. Measures of body composition.
Table 3. Body composition in a 3 compartment model.
Table 4. Important messages for families and health care professionals