Figures & data
Figure 1. The chemical structure of FC, different parts of the Chinese herb Rhizoma Paridis, and the inhibitory effect of FC on MM cell viability. (A) The chemical structure of FC (C51H82O20, molecular weight, 1015.2). (B) Leaves and rhizomes of Rhizoma Paridis. (C and D) H929 and ARP1 cells were treated with indicated concentrations of FC for 24 h or with 2 μM FC for 12–48 h, cell viability and the OD values at 450 nm were assessed using the CCK-8 assay. The curves of cell viability (C) and the OD450 values (D) are shown (n = 5). *P < 0.05, difference with control group.
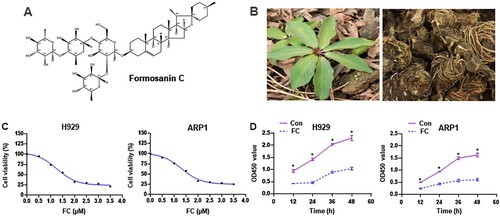
Figure 2. Inhibition of proliferation of MM cells by FC, demonstrated using colony formation assay. H929 and ARP1 cells were incubated in Methocult medium containing 2 μM FC for 10 days in 6-well plates in triplicate. Cell colonies were photographed under a microscope (A), and the numbers of colonies were calculated (B). 5 independent fields per well were included for the counting. All quantified data are expressed as mean ± SEM (n = 3). *P < 0.05, difference with control group.
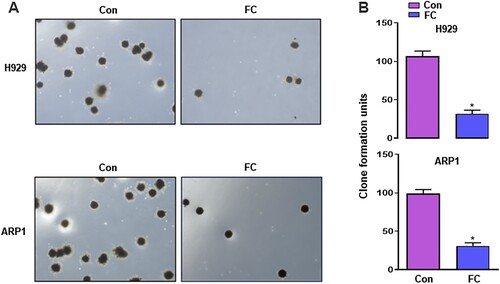
Figure 3. FC induces apoptotic death in MM cells. H929 and ARP1 cells were exposed to FC (2 μM) for 24 h. (A) The percentages of live (the third quadrant), early apoptotic (the fourth quadrant), late apoptotic (the first quadrant), and necrotic cells (the second quadrant) were determined by FACS using annexin-V-FITC/PI staining. Results from a representative experiment are shown. (B) Quantitative analysis of apoptotic cells using FACS. The rate of apoptotic cells corresponds to the sum of the rates of early and late apoptotic cells. (C) Total cell lysates were subjected to western blotting using indicated antibodies. The blots were probed for β-actin as a loading control. Similar results were observed in three independent experiments. (D) The blots for Bcl-2, Bax, and cleaved caspase-3 were semi-quantified. All quantified data are expressed as mean ± SEM (n = 3). *P < 0.05, difference with control group.
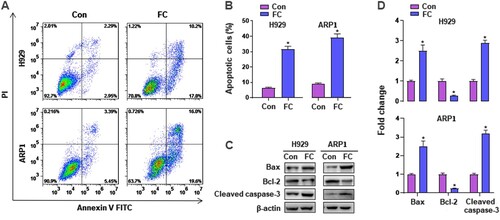
Figure 4. FC triggers activation of autophagy contributing to MM cell death. H929 and ARP1 cells, or H929 and ARP1 cells infected with Ad-GFP-LC3 were treated with FC (2 μM) for 24 h or pre-treated with/without 3-MA (10 μM) for 2 h and then exposed to FC (2 μM) for 24 h. (A and B) Shown are representative GFP-LC3 fluorescence images (in green) (A) and quantified number (B) for GFP-LC3 puncta in the cells. Scale bar: 2 μm. (C and E) Total cell lysates were subjected to western blotting using indicated antibodies. The blots were probed for β-actin as a loading control. Similar results were observed in three independent experiments. (D and F) The blots for LC3-Ⅱ, Beclin 1, Bax, Bcl-2, and cleaved caspase-3 were semi-quantified. All quantified data are expressed as means ± SEM (n = 3-5). *P < 0.05, difference with control group; #P < 0.05, difference with FC group.
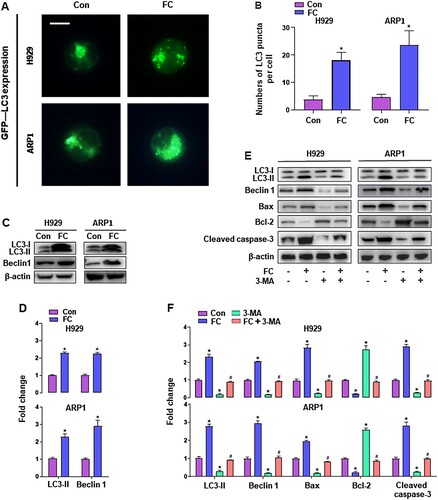
Figure 5. The PI3K/AKT signaling pathway is a potential target of Rhizoma Paridis in myeloma, as revealed by network pharmacology analysis. (A) Venn diagram shows 16 potential therapeutic targets of Rhizoma Paridis in myeloma. (B) Hub targets ranked by degree value in PPI network. The size of the points depends on their value. (C) The top 12 significant terms of KEGG analysis.
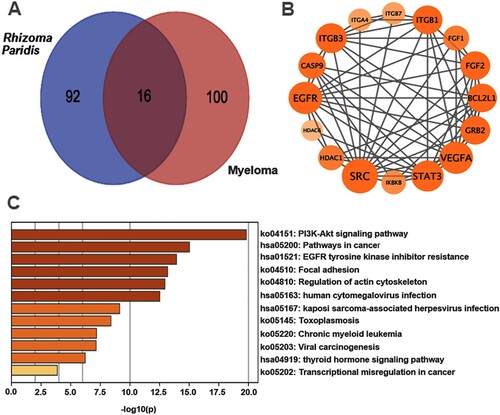
Figure 6. FC inhibits the PI3K/AKT/mTOR pathway, activating autophagy and leading to MM cell apoptosis. H929 and ARP1 cells were treated with FC (2 μM) for 24 h or pre-treated with/without IGF-1 (100 ng/mL) for 1 h and then exposed to FC (2 μM) for 24 h. (A and C) Total cell lysates were subjected to Western blotting using indicated antibodies. The blots were probed for β-actin as a loading control. Similar results were observed in three independent experiments. (B and D) The blots for p-PI3K, p-AKT, p-mTOR, LC3-Ⅱ, Beclin 1, Bax, Bcl-2, and cleaved caspase-3 were semi-quantified. For (B) and (D), all data are expressed as means ± SEM (n = 3). *P < 0.05, difference with control group; #P < 0.05, difference with FC group.
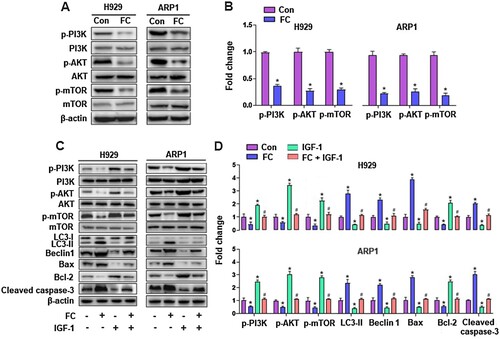
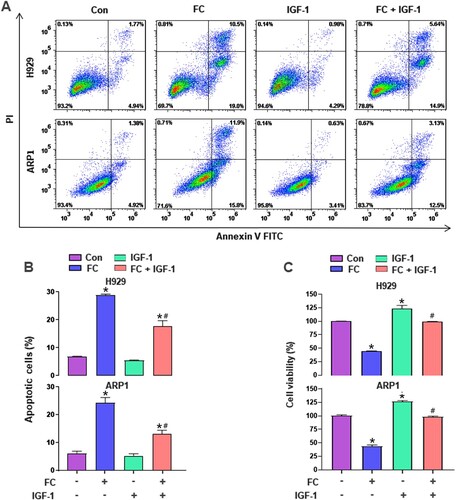
Figure 7. IGF-1 rescues MM cells from FC-triggered apoptosis and -suppressed viability. H929 and ARP1 cells were pre-treated with/without IGF-1 (100 ng/mL) for 1 h and then exposed to FC (2 μM) for 24 h. (A) The percentages of live (the third quadrant), early apoptotic (the fourth quadrant), late apoptotic (the first quadrant), and necrotic cells (the second quadrant) were determined by FACS using annexin-V-FITC/PI staining. Results from a representative experiment are shown. (B) Quantitative analysis of apoptotic cells using FACS. The rate of apoptotic cells corresponds to the sum of the rates of early and late apoptotic cells. (C) Cell viability were assessed using the CCK-8 assay. For (B) and (C), all data are expressed as means ± SEM (n = 3-5). *P < 0.05, difference with control group; #P < 0.05, difference with FC group.