
Figures & data
Table 1. Chemotherapy regimens.
Table 2. Patient characteristics.
Table 3. Response at the end-of-induction.
Figure 1. Simon–Makuch plotsfor overall survival (A) and disease-free survival (B) in all Ph-positive ALL.
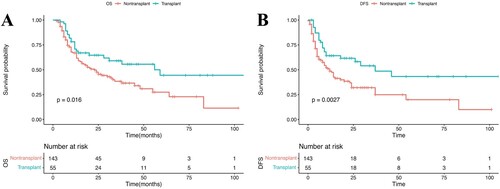
Figure 2. Cumulative incidence curves for relapse and non-relapse mortality(NRM) in all Ph-positive ALL.
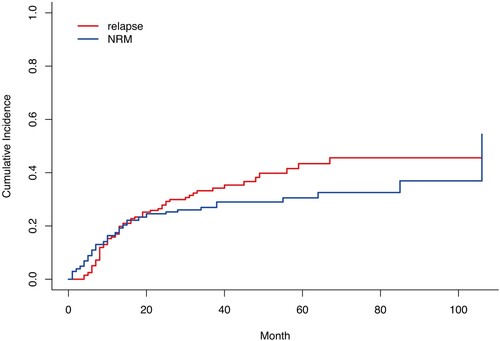
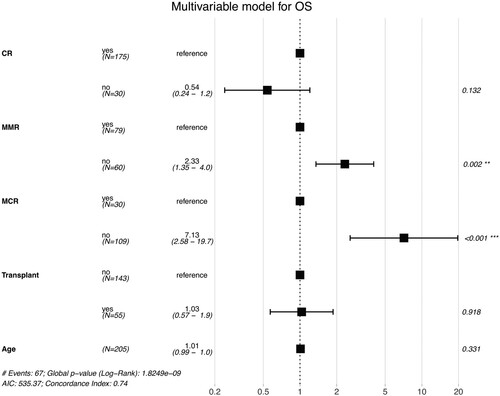
Figure 3. Forest plot summarizing the multivariable model for OS in all Ph-positive ALL.
Data availability statement:
The datasets generated during and/or analyzed during the current study are available from the corresponding author on reasonable request. All data and materials support the published claims and comply with field standards. All the content has not been published elsewhere, nor is it under consideration for publication anywhere else.