
Figures & data
Figure 1. Chest CT images showing the dynamic changes in interstitial lung disease. A: on the 2nd day; B: on the 9th day; C: before discharge.
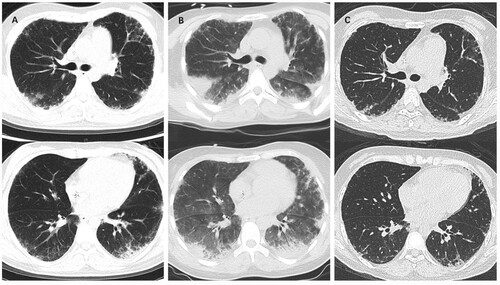
Table 1. The literature review of severe therapy-induced toxicities in DC patients.
Data Availability Statement
The data generated during and/or analysed during the current study are available from the corresponding author on reasonable request.