Figures & data
Figure 1. PRISMA flowchart illustrating the selection of studies included in our analyses.
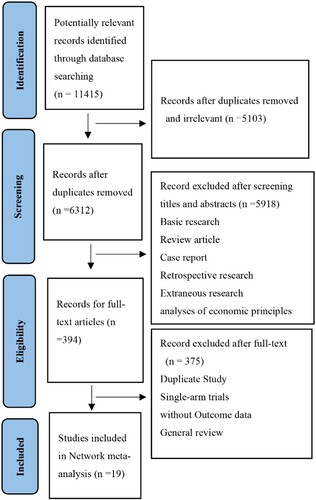
Figure 2. Results of risk of bias assessment.
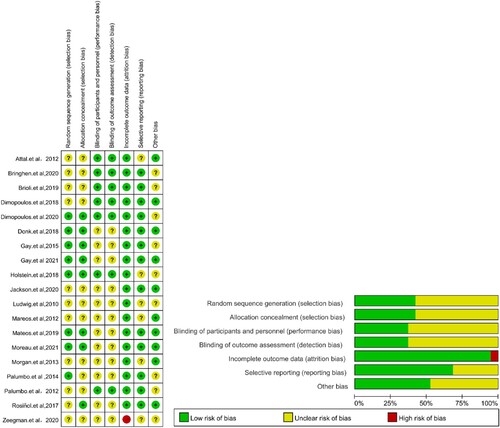
Table 1. Baseline characteristics of the studies included in this NMA.
Table 2. Matrix of pairwise comparisons of regimens on 6 months OS rate (shown as odds ratios and 95% confidence intervals).
Table 3. Matrix of pairwise comparisons of regimens on 12 months OS rate (shown as odds ratios and 95% confidence intervals).
Table 4. Matrix of pairwise comparisons of regimens on 18 months OS rate (shown as odds ratios and 95% confidence intervals).
Table 5. Matrix of pairwise comparisons of regimens on 24 months OS rate (shown as odds ratios and 95% confidence intervals).
Table 6. Matrix of pairwise comparisons of regimens on 30 months OS rate (shown as odds ratios and 95% confidence intervals).
Table 7. Matrix of pairwise comparisons of regimens on 36 months OS rate (shown as odds ratios and 95% confidence intervals).
Table 8. Matrix of pairwise comparisons of regimens on 42 months OS rate (shown as odds ratios and 95% confidence intervals).
Table 9. Matrix of pairwise comparisons of regimens on 48 months OS rate (shown as odds ratios and 95% confidence intervals).
Table 10. Matrix of pairwise comparisons of regimens on 6 months PFS rate (shown as odds ratios and 95% confidence intervals).
Table 11. Matrix of pairwise comparisons of regimens on 12 months PFS rate (shown as odds ratios and 95% confidence intervals).
Table 12. Matrix of pairwise comparisons of regimens on 18 months PFS rate (shown as odds ratios and 95% confidence intervals).
Table 13. Matrix of pairwise comparisons of regimens on 24 months PFS rate (shown as odds ratios and 95% confidence intervals).
Table 14. Matrix of pairwise comparisons of regimens on 30 months PFS rate (shown as odds ratios and 95% confidence intervals).
Table 15. Matrix of pairwise comparisons of regimens on 36 months PFS rate (shown as odds ratios and 95% confidence intervals).
Table 16. Matrix of pairwise comparisons of regimens on 42 months PFS rate (shown as odds ratios and 95% confidence intervals).
Figure 3. A. Network plot of pairwise comparisons of regimens on 6,12,18 months OS. B. Network plot of pairwise comparisons of regimens on 24, 30 months OS. C. Network plot of pairwise comparisons of regimens on 36,42,48 months OS. D. Network plot of pairwise comparisons of regimens on 6, 12, 18, 24, 30, 36 months PFS. E. Network plot of pairwise comparisons of regimens on 42 months PFS. CarfilzomibLen: Carfilzomib-lenalidomide; BortThal: bortezomib-thalidomide; IFN: interferon; LenPred: lenalidomide- prednisone; Thal: thalidomide; ThalIFN: thalidomide- interferon.
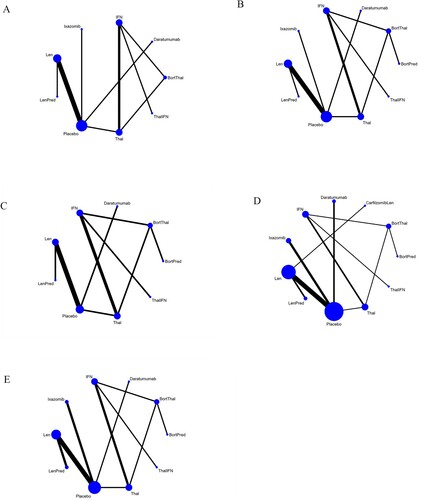
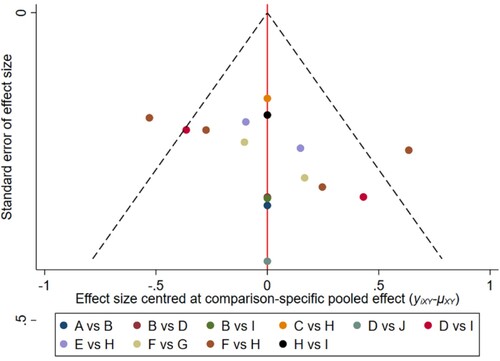
Figure 4. The network funnel plots of pairwise comparisons of regimens on 6 months OS rate. Abbreviation: A = BortThal, B = Daratumumab, C = IFN, D = Ixazomib, E = Len, F = LenPred, G = Placebo, H = Thal, I = ThalIFN. The network funnel plots shows that there exist small sample effects in the studies of lenalidomide comparing placebo. BortThal: bortezomib-thalidomide; IFN: interferon; LenPred: lenalidomide- prednisone; Thal: thalidomide; ThalIFN: thalidomide- interferon.
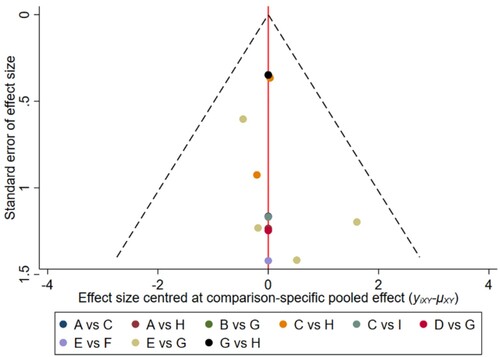
Figure 5. The network funnel plots of pairwise comparisons of regimens on 12 months OS rate. Abbreviation: A = BortThal, B = Daratumumab, C = IFN, D = Ixazomib, E = Len, F = LenPred, G = Placebo, H = Thal, I = ThalIFN. The network funnel plots shows that there exist small sample effects in the studies of bortezomib-thalidomide comparing thalidomide. BortThal: bortezomib-thalidomide; IFN: interferon; LenPred: lenalidomide- prednisone; Thal: thalidomide; ThalIFN: thalidomide- interferon.
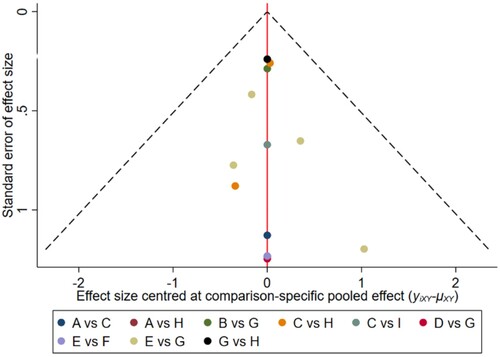
Figure 6. The network funnel plots of pairwise comparisons of regimens on 18 months OS rate. Abbreviation: A = BortThal, B = Daratumumab, C = IFN, D = Ixazomib, E = Len, F = LenPred, G = Placebo, H = Thal, I = ThalIFN. The network funnel plots shows that there exist small sample effects in the studies of lenalidomide comparing placebo. BortThal: bortezomib-thalidomide; IFN: interferon; LenPred: lenalidomide- prednisone; Thal: thalidomide; ThalIFN: thalidomide- interferon.
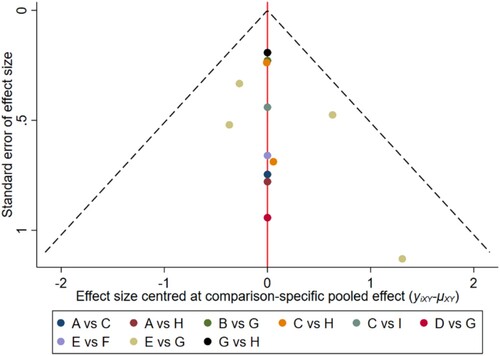
Figure 7. The network funnel plots of pairwise comparisons of regimens on 24 months OS rate. Abbreviation: A = BortPred, B = BortThal, C = Daratumumab, D = IFN, E = Ixazomib, F = Len, G = LenPred, H = Placebo, I = Thal, J = ThalIFN. The network funnel plots shows that there exist small sample effects in the studies of lenalidomide comparing placebo. BortThal: bortezomib-thalidomide; IFN: interferon; LenPred: lenalidomide- prednisone; Thal: thalidomide; ThalIFN: thalidomide- interferon.
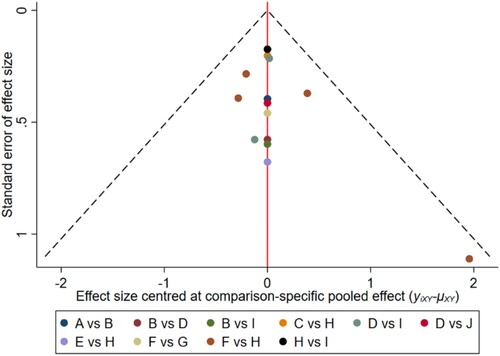
Figure 8. The network funnel plots of pairwise comparisons of regimens on 30 months OS rate. Abbreviation: A = BortPred, B = BortThal, C = Daratumumab, D = IFN, E = Ixazomib, F = Len, G = LenPred, H = Placebo, I = Thal, J = ThalIFN. The network funnel plots shows that there exist small sample effects in the studies of ixazomib comparing placebo. BortThal: bortezomib-thalidomide; IFN: interferon; LenPred: lenalidomide- prednisone; Thal: thalidomide; ThalIFN: thalidomide- interferon.
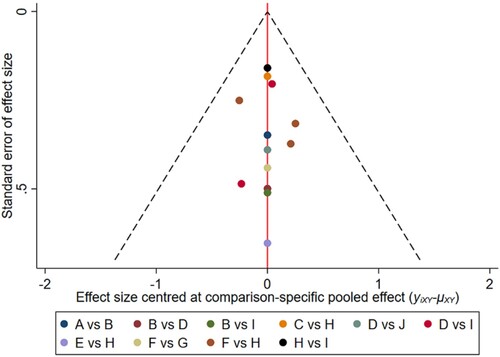
Figure 9. The network funnel plots of pairwise comparisons of regimens on 36 months OS rate. Abbreviation: A = BortPred, B = BortThal, C = Daratumumab, D = IFN, E = Len, F = LenPred, G = Placebo, H = Thal, I = ThalIFN. The network funnel plots shows that there exist small sample effects in the studies of bortezomib-thalidomide comparing thalidomide. BortThal: bortezomib-thalidomide; IFN: interferon; LenPred: lenalidomide- prednisone; Thal: thalidomide; ThalIFN: thalidomide- interferon.
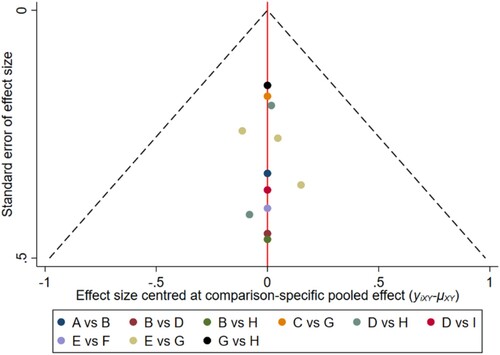
Figure 10. The network funnel plots of pairwise comparisons of regimens on 42 months OS rate. Abbreviation: A = BortPred, B = BortThal, C = Daratumumab, D = IFN, E = Len, F = LenPred, G = Placebo, H = Thal, I = ThalIFN. The network funnel plots shows that there exist small sample effects in the studies of bortezomib-thalidomide comparing thalidomide. BortThal: bortezomib-thalidomide; IFN: interferon; LenPred: lenalidomide- prednisone; Thal: thalidomide; ThalIFN: thalidomide- interferon.
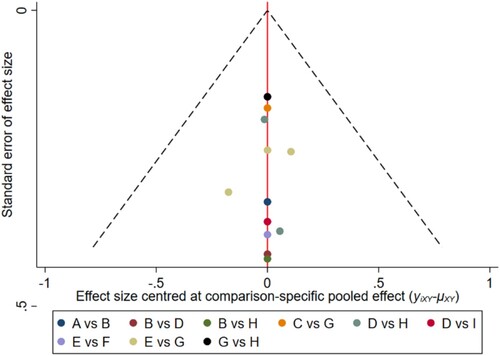
Figure 11. The network funnel plots of pairwise comparisons of regimens on 48 months OS rate. Abbreviation: A = BortPred, B = BortThal, C = Daratumumab, D = IFN, E = Len, F = LenPred, G = Placebo, H = Thal, I = ThalIFN. The network funnel plots shows that there exist small sample effects in the studies of bortezomib-thalidomide comparing thalidomide. BortThal: bortezomib-thalidomide; IFN: interferon; LenPred: lenalidomide- prednisone; Thal: thalidomide; ThalIFN: thalidomide- interferon.
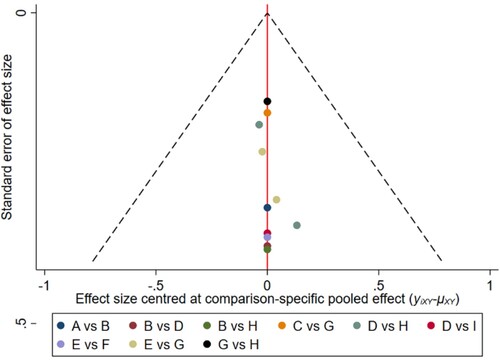
Figure 12. The network funnel plots of pairwise comparisons of regimens on 6 months PFS rate. Abbreviation: A = BortPred, B = BortThal, C = CarfilzomibLen, D = Daratumumab, E = IFN, F = Ixazomib, G = Len, H = LenPred, I = Placebo, J = Thal, K = ThalIFN. The network funnel plots shows that there exist small sample effects in the studies of lenalidomide comparing placebo. CarfilzomibLen: Carfilzomib-lenalidomide; BortThal: bortezomib-thalidomide; IFN: interferon; LenPred: lenalidomide- prednisone; Thal: thalidomide; ThalIFN: thalidomide- interferon.
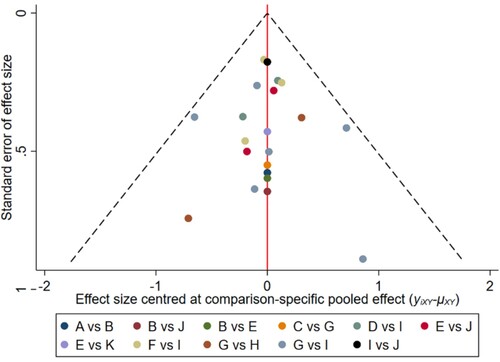
Figure 13. The network funnel plots of pairwise comparisons of regimens on 12 months PFS rate. Abbreviation: A = BortPred, B = BortThal, C = CarfilzomiLen, D = Daratumumab, E = IFN, F = Ixazomib, G = Len, H = LenPred, I = Placebo, J = Thal, K = ThalIFN. The network funnel plots shows that there exist small sample effects in the studies of lenalidomide comparing placebo. CarfilzomibLen: Carfilzomib-lenalidomide; BortThal: bortezomib-thalidomide; IFN: interferon; LenPred: lenalidomide- prednisone; Thal: thalidomide; ThalIFN: thalidomide- interferon.
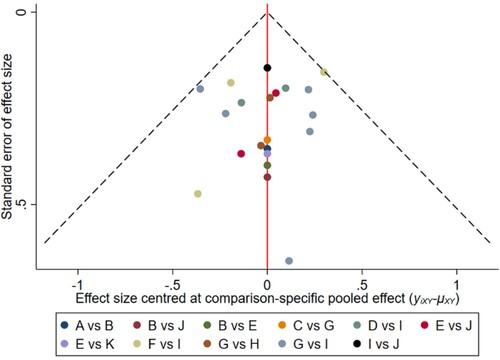
Figure 14. The network funnel plots of pairwise comparisons of regimens on 18 months PFS rate. Abbreviation: A = BortPred, B = BortThal, C = CarfilzomiLen, D = Daratumumab, E = IFN, F = Ixazomib, G = Len, H = LenPred, I = Placebo, J = Thal, K = ThalIFN. The network funnel plots shows that there exist small sample effects in the studies of lenalidomide comparing placebo. CarfilzomibLen: Carfilzomib-lenalidomide; BortThal: bortezomib-thalidomide; IFN: interferon; LenPred: lenalidomide- prednisone; Thal: thalidomide; ThalIFN: thalidomide- interferon.
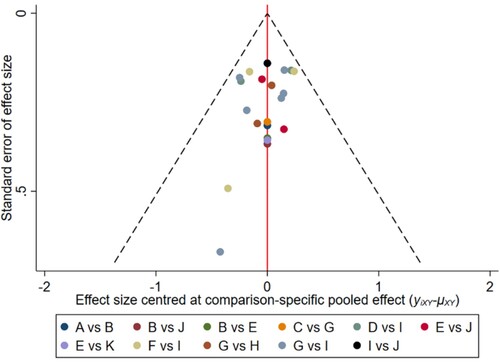
Figure 15. The network funnel plots of pairwise comparisons of regimens on 24 months PFS rate. Abbreviation: A = BortPred, B = BortThal, C = CarfilzomiLen, D = Daratumumab, E = IFN, F = Ixazomib, G = Len, H = LenPred, I = Placebo, J = Thal, K = ThalIFN. The network funnel plots shows that there exist small sample effects in the studies of lenalidomide comparing placebo. CarfilzomibLen: Carfilzomib-lenalidomide; BortThal: bortezomib-thalidomide; IFN: interferon; LenPred: lenalidomide- prednisone; Thal: thalidomide; ThalIFN: thalidomide- interferon.
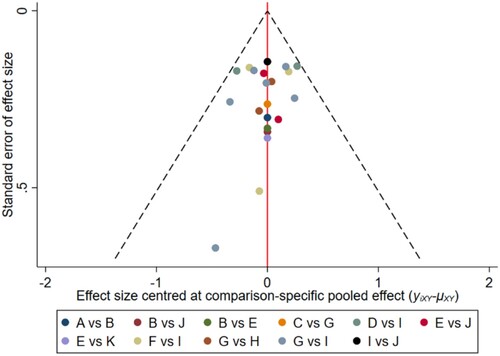
Figure 16. The network funnel plots of pairwise comparisons of regimens on 30 months PFS rate. Abbreviation: A = BortPred, B = BortThal, C = CarfilzomiLen, D = Daratumumab, E = IFN, F = Ixazomib, G = Len, H = LenPred, I = Placebo, J = Thal, K = ThalIFN. The network funnel plots shows that there exist small sample effects in the studies of ixazomib comparing placebo. CarfilzomibLen: Carfilzomib-lenalidomide; BortThal: bortezomib-thalidomide; IFN: interferon; LenPred: lenalidomide- prednisone; Thal: thalidomide; ThalIFN: thalidomide- interferon.
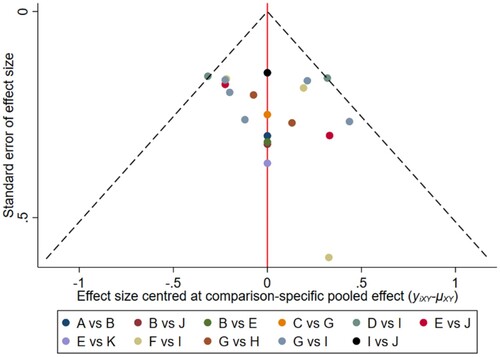
Figure 17. The network funnel plots of pairwise comparisons of regimens on 36 months PFS rate. Abbreviation: A = BortPred, B = BortThal, C = CarfilzomiLen, D = Daratumumab, E = IFN, F = Ixazomib, G = Len, H = LenPred, I = Placebo, J = Thal, K = ThalIFN. The network funnel plots shows that there exist small sample effects in the studies of thalidomide-interferon comparing interferon. CarfilzomibLen: Carfilzomib-lenalidomide; BortThal: bortezomib-thalidomide; IFN: interferon; LenPred: lenalidomide- prednisone; Thal: thalidomide; ThalIFN: thalidomide- interferon.
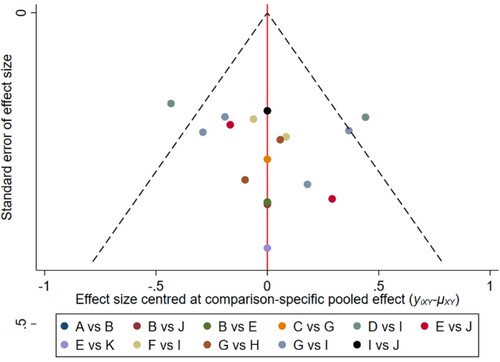
Figure 18. The network funnel plots of pairwise comparisons of regimens on 42 months PFS rate. Abbreviation: A = BortPred, B = BortThal, C = Daratumumab, D = IFN, E = Ixazomib, F = Len, G = LenPred, H = Placebo, I = Thal, J = ThalIFN. The network funnel plots shows that there exist small sample effects in the studies of thalidomide-interferon comparing interferon. BortThal: bortezomib-thalidomide; IFN: interferon; LenPred: lenalidomide- prednisone; Thal: thalidomide; ThalIFN: thalidomide- interferon.