Figures & data
Figure 1. (A) Histogram of the percentage of bone marrow immune cells in 10 cases of AML and 5 cases of normal subjects. (B) Analysis of immune cell differences in AML vs normal subjects. (C) Effect of Treg on overall survival (OS) of AML patients. (*P < 0.05, **P < 0.01).
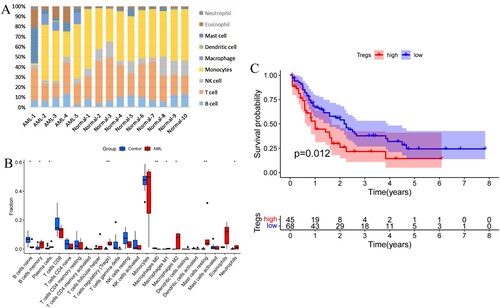
Figure 2. (A) Tree diagram and feature heat map. (B) Relationship between the goodness of fit and different soft thresholds. (C) Relationship between the average number of connections and different soft thresholds. (D) Module clustering diagram. (E) Association diagram between gene modules and immune cell characteristics. (F) Scatter plot of GS and MM in green module.
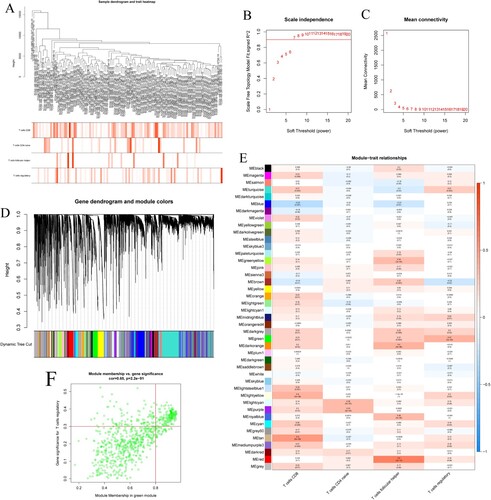
Figure 3. (A) Forest plot for univariate Cox regression analysis. (B) Plot of LASSO coefficients for the five prognostic genes. (C) Tenfold cross-validation plot for adjusting the parameters in the LASSO model. (D) Risk score, risk status and risk heat map for the training sets. (E) Risk score, risk status and risk heat map for the training sets. (F,G) Training set and validation set survival analysis. (H,I) Training set and validation set ROC curves.
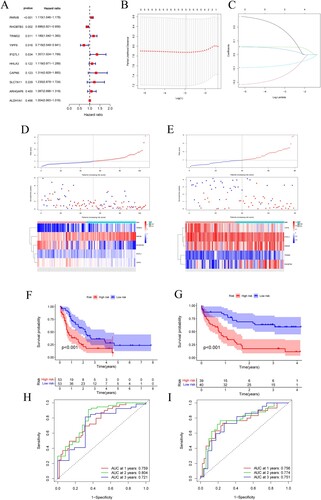
Table 1. Univariate and multivariate Cox regression analysis.
Figure 4. (A) Nomogram predicting OS in AML patients. (B–D) Calibration diagram for internal validation.
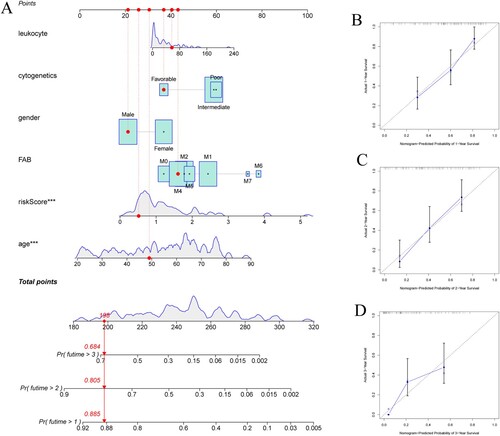
Table 2. Correlation of clinical characteristics of AML (non-M3) patients.
Figure 5. (A) Mutation waterfall in the high-risk group. (B) Mutation waterfall in the low-risk group. (C–F) Functional and pathway enrichment map of GSEA in high and low-risk groups. (C,D) GO analysis in the high-risk group and the low-risk group. (E,F) KEGG pathway enrichment analysis in the high-risk group and the low-risk group.
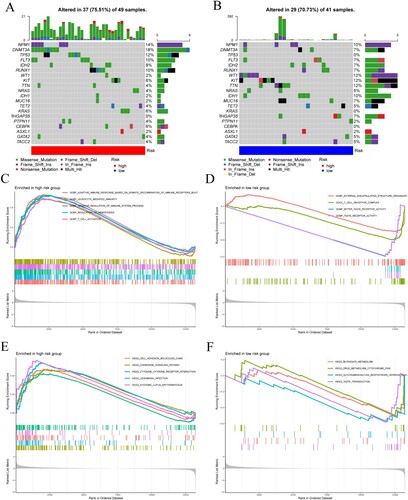
Figure 6. (A) Difference in Treg infiltration level between high-risk and low-risk groups. (B) Different expression level of the Treg surface marker FOXP3. (C) Expression of immune checkpoint molecules in high-risk and low-risk groups. (D) TIDE prediction score for high-risk and low-risk groups. (E) T-cell exclusion prediction score. (F) T-cell dysfunction prediction score. (*P < 0.05; **P < 0.01; P < 0.001; ns, no significance).
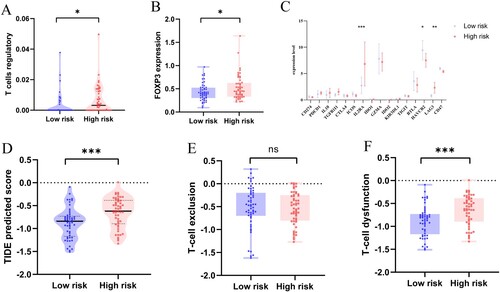
Figure 7. Kaplan–Meier plot of OS for AML patients in high-risk group and low-risk group with age 65 and older (A), with male group (B), with WBC greater than 10 × 109/L(C), with age less than 65(D), with female group (E), with WBC less than or equal to 10 × 109/L(F).
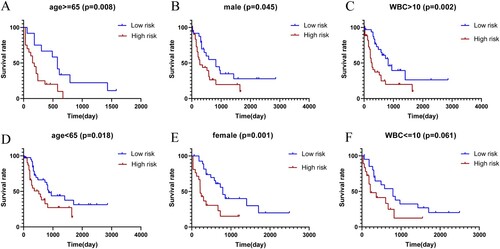
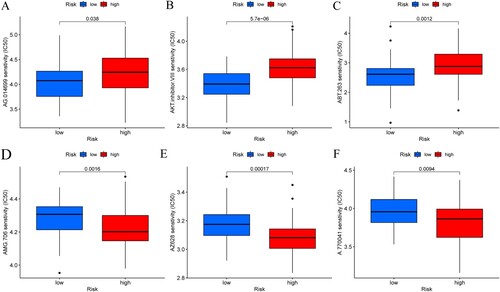
Figure 8. (A–F) The sensitivity of multiple potential anti-tumor drugs in different risk groups.