
Figures & data
Figure 1. Literature screening flow chart.
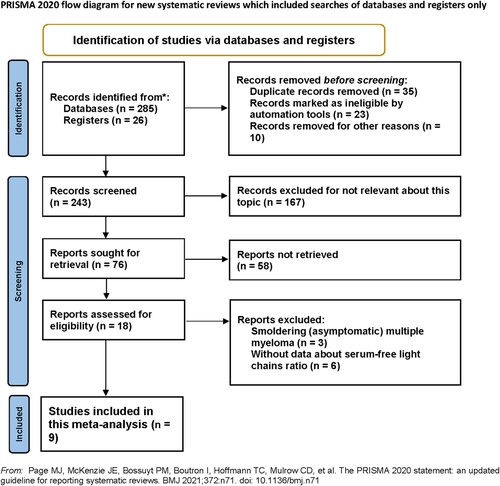
Table 1. Baseline characteristics of included studies.
Table 2. Abnormal sFLC ratio in the included studies.
Figure 2. Forest plot of the association between sFLC ratio and OS.
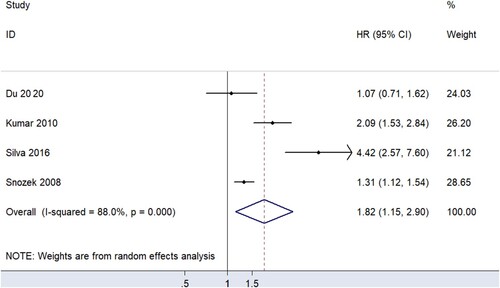
Figure 3. Funnel plot of the association between sFLC ratio and OS.
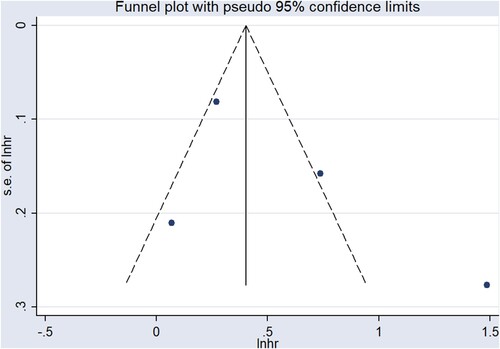
Figure 4. Sensitivity analysis of the association between sFLC ratio and OS.
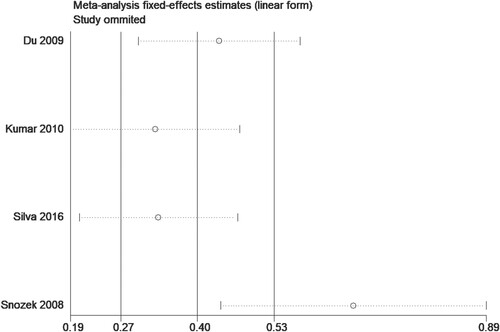
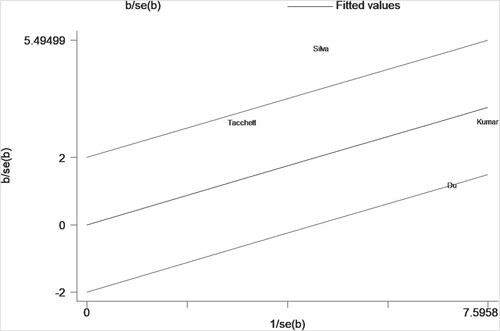
Figure 5. Galbraith plot of the association between sFLC ratio and OS.
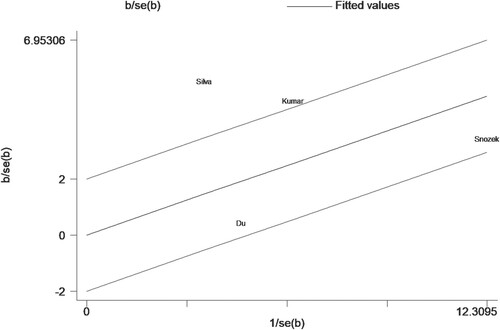
Figure 6. Forest plot of the association between sFLC ratio and PFS.
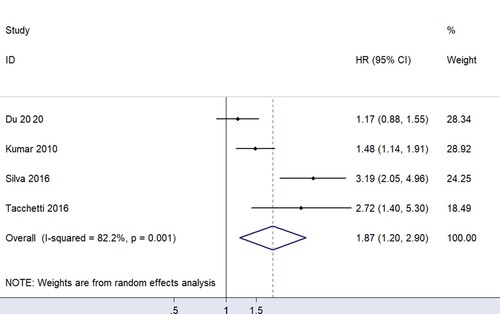
Figure 7. Funnel plot of the association between sFLC ratio and PFS.
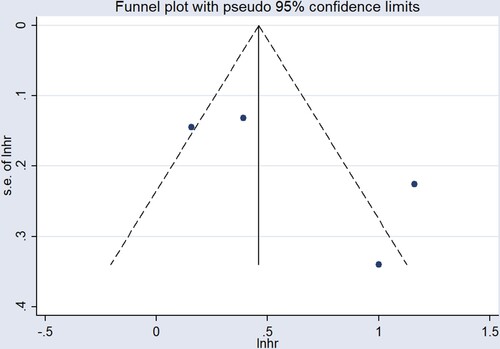
Figure 8. Sensitivity analysis of the association between sFLC ratio and PFS.
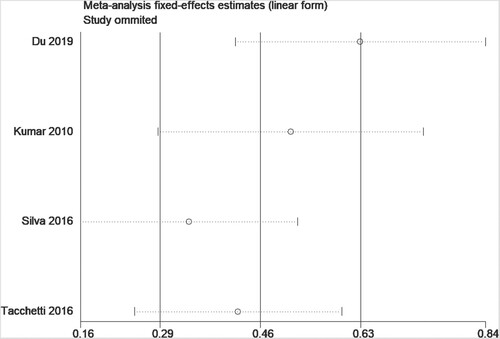
Figure 9. Galbraith plot of the association between sFLC ratio and PFS.
Data availability statement
The original contributions presented in the study are included in the article/supplementary material. Further inquiries can be directed to the corresponding author.