Figures & data
Figure 1. Venn diagram of DEGs from the 3 GEO datasets. This study identified DEGs with the fold change over 1 and adjusted P-values less than 0.05 within the gene expression profiling sets of GSE19429, GSE58831, and GSE2779, which exhibited the overlap of twenty-six genes.

Table 1. The statistics of the three microarray databases were derived from the GEO database.
Table 2. The enriched GO terms of DEGs.
Table 3. The KEGG pathway analysis of DEGs.
Figure 2. A: The PPI network of DEGs. Colored nodes denote query proteins, edges stand for interactions between proteins, and the line color proves interactions between query proteins. B: Hub gene and its PPI network. C: The network core module was confirmed by mcode.
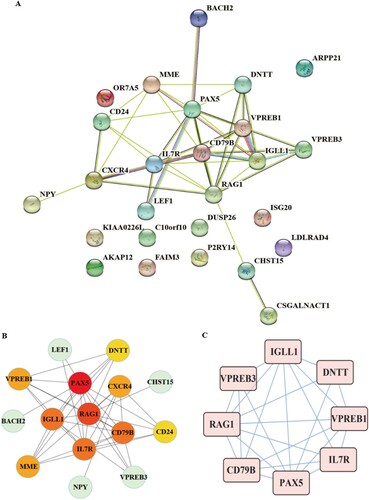
Figure 3. The relative expression levels of PAX5, and RAG1 in MDS patients and normal controls (MDS = 20, Normal = 10).
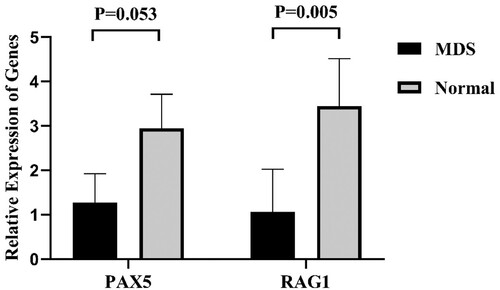
Figure 4. A: The relative expression of RAG1 in MDS patients and normal controls. B: Expression of RAG1 in each group. Normal controls (n = 29), Low + INT-1((low risk + intermediate-1 risk) (n = 31)), INT-2 + High ((intermediate-2 risk + high risk) (n = 28)). Mann–Whitney’s U test was used to compare all the differences in continuous variables between two groups.
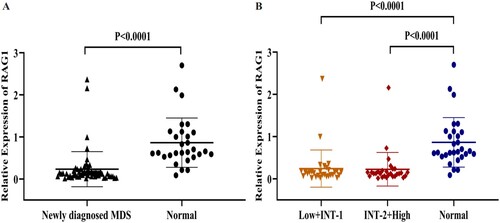
Table 4. Comparison of clinical and molecular characteristics with the expression of RAG1 in MDS patients.
Figure 5. A: ROC analysis using RAG1 for separating MDS cases from normal controls. B: Kaplan-Meier survival curves for MDS patients were divided into two groups based on the median value of the RAG1 expression level.
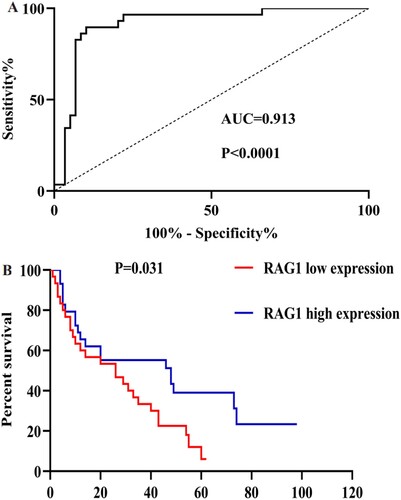
Table 5. Uni/multivariate analysis concerning progression and overall survival.
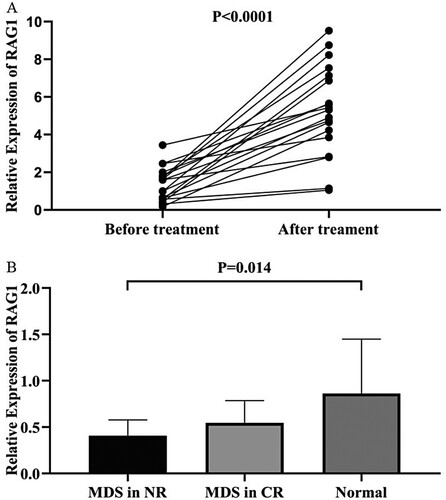
Figure 6. A: Changes in RAG1 expression in MDS patients before and after treatment. B: Comparison of RAG1 expression level in MDS patients who received treatment with normal controls.