Figures & data
Table 1. Primer sequences.
Figure 1. MiR-92a-3p is upregulated in erythroid precursor cells from patients with β-thalassemia. (A) the purity of CD34 + cells was detected by flow cytometry; (B-C) the expression of CD71 and CD235a in erythroid precursor cells on the 14th day of differentiation induction was measured by flow cytometry; (D-I) the expression of miR-17, miR-18a, miR-19a, miR-20a, miR-19b-1, and miR-92a-3p was examined by qRT-PCR test; (J) miR-92a-3p expression was tested by qRT-PCR on the 0, 7th and 14th day of erythroid differentiation of HPCs from β-thalassemia patients. (K) the correlation between miR-92a-3p and HbF was measured by Pearson correlation analysis. **P < 0.01, ***P < 0.001. Normal group, n = 15; beta thalassemia group, n = 20. Each experiment was repeated three times. All data were shown in form of mean ± standard deviation and error bars represent standard deviation. qRT-PCR, quantitative real-time polymerase chain reaction; HbF, hemoglobin F.
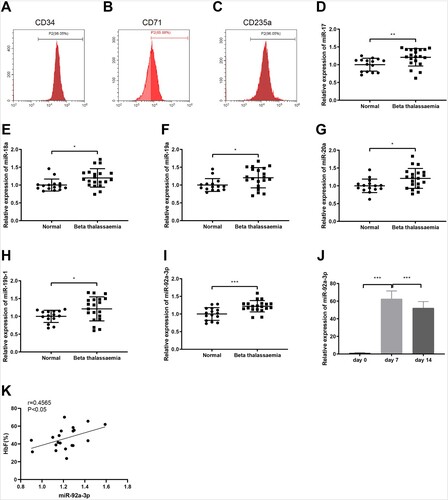
Table 2. Clinical information.
Figure 2. MiR-92a-3p increases γ-globin expression and restrains oxidative stress in erythroid precursor cells. (A) transfection efficiency of miR-92a-3p mimic and inhibitor; (B) qRT-PCR experiment was used to measure miR-92a-3p expression; (C-D) the expression of γ-globin/(γ-globin + β-globin) was detected by qRT-PCR and western blot tests; (E) ROS level was measured by flow cytometry; (F) MDA content was assayed with the colorimetric method; (G) SOD content was tested by a SOD kit; (H) GSH level was detected by flow cytometry; (I) cell apoptosis was evaluated by flow cytometry, *P < 0.05, **P < 0.01, ***P < 0.001. Each experiment was repeated three times. All data were shown in form of mean ± standard deviation and error bars represent standard deviation. PI: Annexin FACS: Q1-UL: necrotic cells; Q1-UR: late apoptotic cells; Q1-LR: early apoptotic cells; Q1-LL: living cells. ROS, reactive oxygen species; MDA, malondialdehyde; SOD, superoxide dismutase; GSH, glutathione; qRT-PCR, quantitative real-time polymerase chain reaction.
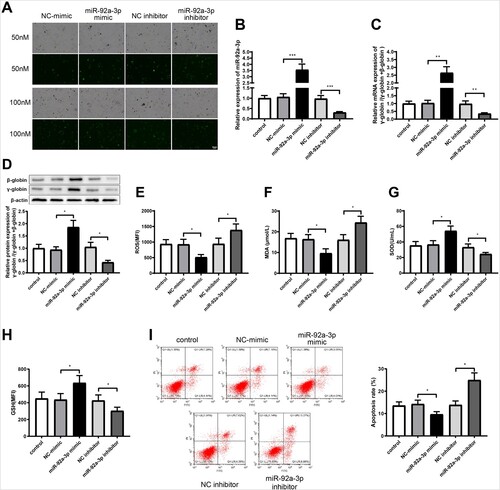
Figure 3. MiR-92a-3p downregulates BCL11A expression. (A) The wild and mutant sequences of the binding site of miR-92a-3p to BCL11A; (B) dual luciferase reporter gene assay for verifying the binding between miR-92a-3p and BCL11A; (C) AGO2-RIP was used to test the binding of miR-92a-3p to BCL11A; after the cells were transfected with miR-92a-3p mimic or miR-92a-3p inhibitor, (D-E) qRT-PCR and western blot tests were used to examine BCL11A expression. *P < 0.05, **P < 0.01, ***P < 0.001. Each experiment was repeated three times. All data were expressed as mean ± standard deviation and error bars represent standard deviation. AGO2-RIP, argonaute 2-RNA binding protein immunoprecipitation; qRT-PCR, quantitative real-time polymerase chain reaction.
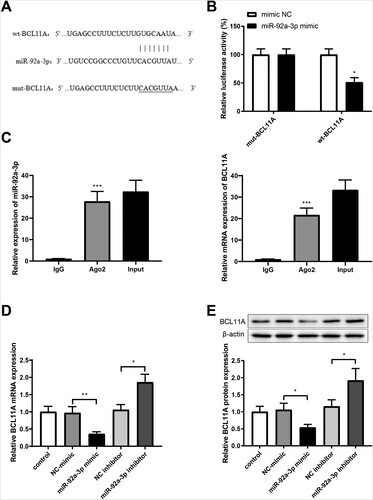
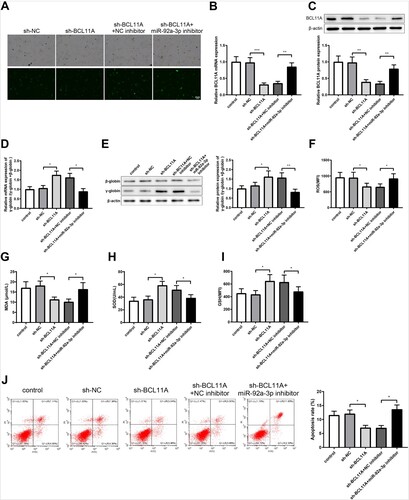
Figure 4. MiR-92a-3p upregulates γ-globin and reduces oxidative stress in erythroid precursor cells by downregulating BCL11A. (A) transfection efficiency of sh-BCL11A; (B-E) qRT-PCR and western blot tests were used to examine the expression of BCL11A and γ-globin/(γ-globin + β-globin) in erythroid precursor cells; (F) ROS level was measured by flow cytometry; (G) MDA content was detected by the colorimetric method; (H) SOD level was tested using a SOD kit; (I) flow cytometry was applied to measure GSH content; (J) cell apoptosis was detected by flow cytometry. *P < 0.05, **P < 0.01, ***P < 0.001. Each experiment was repeated three times. All data were expressed as mean ± standard deviation and error bars represent standard deviation. PI:Annexin FACS: Q1-UL: necrotic cells; Q1-UR: late apoptotic cells; Q1-LR: early apoptotic cells; Q1-LL: living cells. ROS, reactive oxygen species; MDA, malondialdehyde; SOD, superoxide dismutase; GSH, glutathione; qRT-PCR, quantitative real-time polymerase chain reaction.