Figures & data
Table 1. Characteristics of AML patients.
Figure 1. MALT1 was reduced in AML patients compared to HCs and DCs. Comparison of MALT1 expression among AML patients, DCs, and HCs (A). ROC curve analyses of MALT1 expression in distinguishing AML patients from DCs (B); AML patients from HCs (C); DCs from HCs (D).
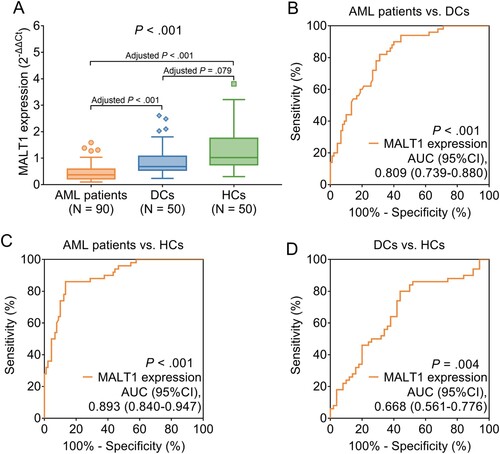
Table 2. Correlation of MALT1 expression with clinical characteristics in AML patients.
Figure 2. MALT1 was elevated during induction treatment in AML patients. Comparison of pre-treatment and post-treatment MALT1 expression in total AML patients (A); in AML patients with CR (B); in AML patients with non-CR (C). Comparison of MALT1 expressions between AML patients with CR and AML patients with non-CR (D). Comparison of MALT1 expression increment (E) and MALT1 expression increment % (F) between AML patients with CR and AML patients with non-CR.
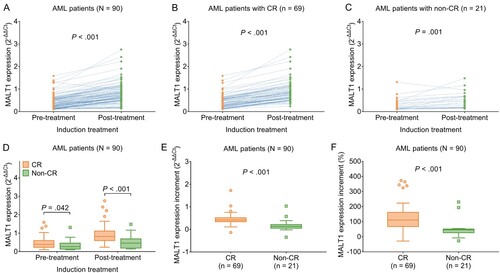
Figure 3. Pre-treatment and post-treatment MALT1 low expression were linked with unfavorable survival profile in AML patients. Correlation of pre-treatment MALT1 low (vs. high) (A) and pre-treatment MALT1 quartile (B) with accumulating EFS. Association of pre-treatment MALT1 low (vs. high) (C) and pre-treatment MALT1 quartile (D) with accumulating OS. Correlation of post-treatment MALT1 low (vs. high) (E) and post-treatment MALT1 quartile (F) with accumulating EFS. Association of post-treatment MALT1 low (vs. high) (G) and post-treatment MALT1 quartile with accumulating OS (H).
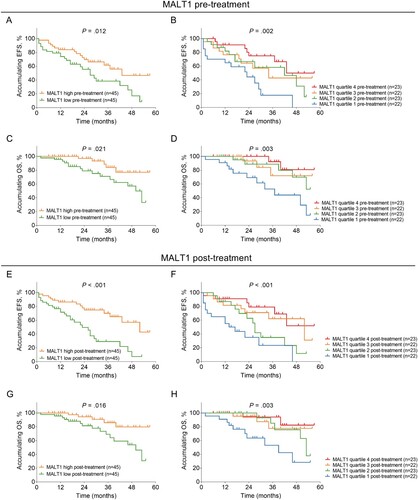
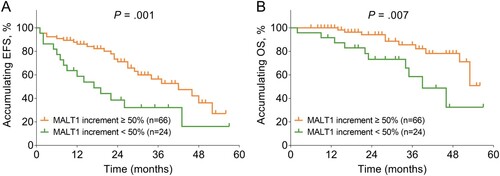
Figure 4. MATL1 increment < 50% was related to shorter accumulating EFS and OS in AML patients. Relationship between MALT1 increment < 50% (vs. increment ≥ 50%) and accumulating EFS (A) as well as accumulating OS (B).