
Figures & data
Figure 1. Distribution of mutation sites of PTPN11 mutations. The number in the circle represents the number of mutations, with the most commonly mutated loci being E76 (19/99, 19.2%), D61 (16/99, 16.2%), A72 (12/99, 12.1%), G503 (7/99, 7.1%), and S502 (8/99, 8.1%).
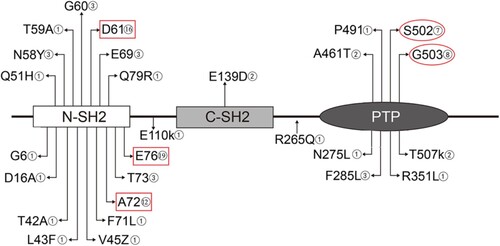
Figure 2. Catastrophe distribution waterfall of acute myeloid leukemia (AML) with PTPN11 mutations. DNMT3A mutation rate in PTPN11 mutation-positive AML patients was 29.7% (22/74); the FLT3-ITD mutation rate was 25.6% (19/74), and the NPM1 mutation rate was 32.4% (24/74).
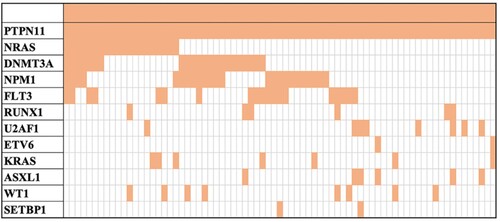
Table 1. Baseline characteristics of PTPN11 mutation-positive acute myeloid leukemia patients.
Table 2. Univariate analysis of the OS analysis in PTPN11 mutations positive AML patients.
Table 3. Multivariate analysis of the OS analysis in PTPN11 mutations-positive AML patients.
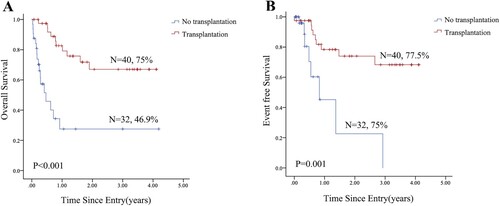
Figure 3. Kaplan-Meier overall survival and event free survival curves of acute myeloid leukemia (AML) with PTPN11 mutations showed that the patients who underwent transplantation. A: overall survival; B: event free survival.
Data availability statement
The data that supports the findings of this study are available in the supplementary material of this article.