
Figures & data
Table 1. MR parameters.
Figure 1. Healthy volunteer male 10 years old. (A) 3D-DESS image shows intact articular cartilage morphology of the medial femoral condyle of the left knee with a smooth surface and no obvious signal abnormality. (B) The T2 mapping pseudo-color image shows uniform distribution of cartilage color scale and intact articular surface distribution. (C) MRI SWI image shows intact articular cartilage morphology with a smooth surface and no magnetic sensitive low signal shadow in the joint space.
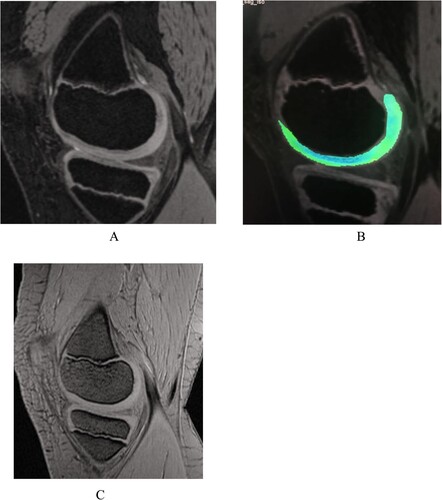
Figure 3. Hemophilic arthropathy Experimental group A Male 9 years old. (A) The 3D-DESS image showed intact articular cartilage morphology of the medial femoral condyle of the right knee joint with no obvious signal abnormalities. (B) T2 mapping pseudo-color image showing an uneven distribution of cartilage color scale, uneven color scale in the weight-bearing area of articular cartilage with a small amount of red-yellow scale, and significantly elevated cartilage T2 value. (C) MRI SWI showing a small amount of hemosiderin on the anterior-posterior border of the articular suprapatellar capsule and femoral cartilage. The MRI SWI shows a small amount of iron-containing hematoxylin in the suprapatellar capsule and the anterior-posterior border of the femoral cartilage.
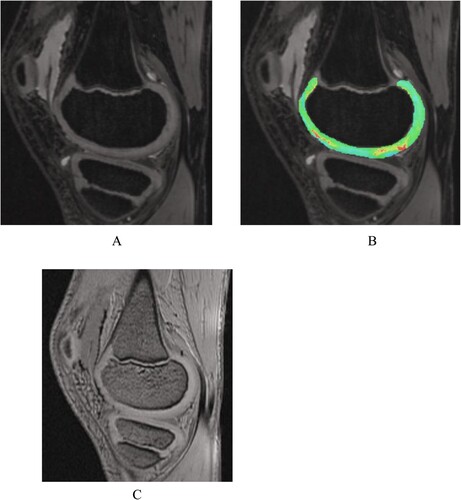
Figure 4. Patient with hemophilic arthropathy Experimental group B Male 11 years old. SWI showing a large amount of iron deposition with hemosiderin at the anterior-posterior border of the suprapatellar capsule and femoral cartilage.
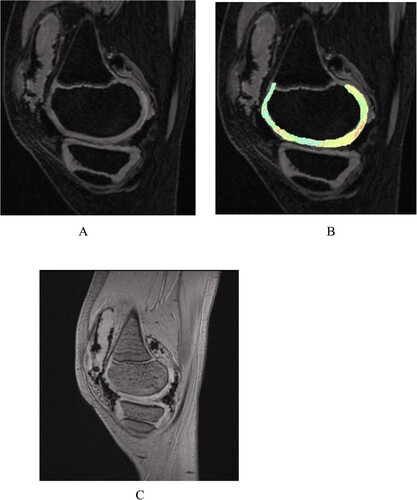
Figure 2. A bar graph showing T2 values for the different regions of interest (ROIs) in the knee. Groups HC (control), A (International Cartilage Repair Society [ICRS] level 0 and I), and B (ICRS levels II and III) were compared for each ROI. * means statistically significant (P < 0.05).
![Figure 2. A bar graph showing T2 values for the different regions of interest (ROIs) in the knee. Groups HC (control), A (International Cartilage Repair Society [ICRS] level 0 and I), and B (ICRS levels II and III) were compared for each ROI. * means statistically significant (P < 0.05).](/cms/asset/222f5b83-0d61-49dd-a097-d19d0946ca69/yhem_a_2147316_f0002_oc.jpg)
Table 2. Comparative results of articular cartilage T2 values in the control group, experimental group A, and experimental group B (x¯±s, ms).